Correlation Between Contact and Non-Contact Surface Analysis Equipment Is Critical — Until It Isn’t
Understanding the differences between measurement methods means their discrepancies can be explained and used as an advantage to produce better correlation.
Share


Contact surface finish measurement and confocal optical surface finish measurement are two different methods of measuring the roughness or irregularity of a surface.
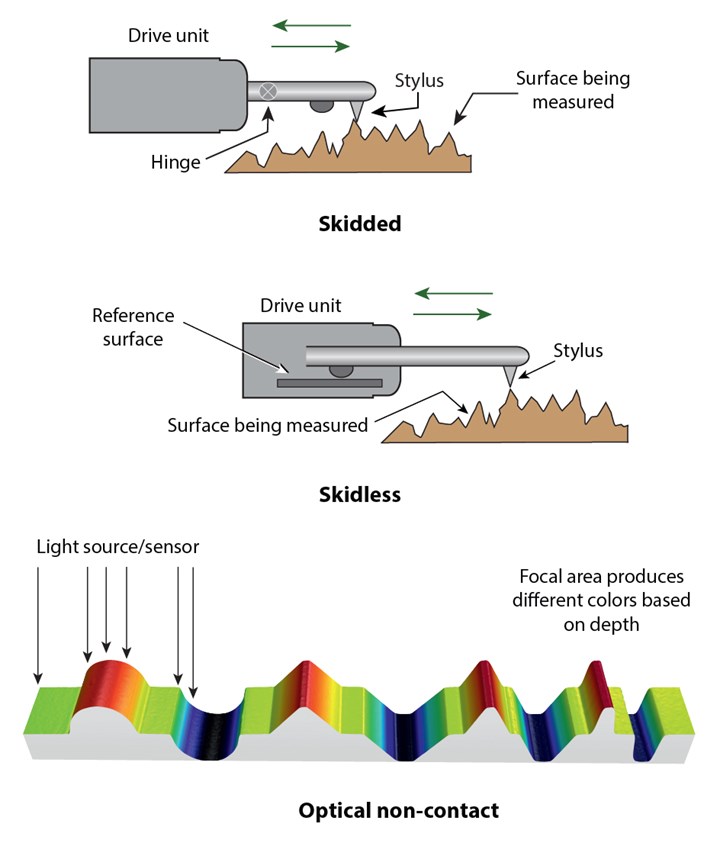
Contact surface finish measurement uses a diamond-tipped probe that moves across the part. There are two basic varieties: skid-type (or averaging systems) and skidless (or profiling systems). Skidded gages have a hinged probe assembly, with the probe riding next to a relatively broad skid that also contacts the workpiece. The skid tends to filter out waviness, so the probe measures only short-wavelength variations. A skid gage has an LCD readout to display the measurement as a single numerical value.
Skidless gages incorporate a smooth, flat internal surface as a reference, so the probe can respond to waviness as well as roughness. In order to allow separate analysis of long- and short-wavelength variations, profiling gages usually generate a chart (on paper or a computer screen) rather than a single numerical result.
Optical surface finish is typically done with a confocal microscope using light to detect the surface contours. The confocal technology has the ability to take pictures of a surface area and then analyze those pictures for depth of focus. The result is a picture of the area showing the depth of the peaks and valleys. Surface finish parameters can be applied from the areal peaks and valleys.
Right off the bat, one can see that there is potential for seeing differences in the results, as the probing method provides line analysis in 2D while the confocal microscope analyzes an area in 3D. In terms of the parameters to analyze the surface roughness, profile or contour, the parameters for 2D and 3D methods conceptually work in similar ways, and there should be a correlation between the two systems. In fact, for many typical surfaces with a roughness result between 0.1 and 10 µm, one will get a good correlation between the contact and the non-contact method. However, factors such as the type of surface, the wavelength of light, the resolution of the detector and the way that parameters are analyzed may reduce the correlation between the systems. By understanding these differences, the discrepancies can be explained, may be used as an advantage or even compensated for to produce better correlation.
In many instances, some reasons for going confocal include surfaces that have a roughness of less than 0.1 µm and/or if the function of the surface area is critical to the product’s performance. With the higher resolution of the optics, it is possible to view into smaller valleys than possible with a contact probing system. Thus, it may not seem as if there is a correlation between the methods.
Take, for example, a process that blasts the surface with a very fine medium. When measuring the surface with a probing system, one could obtain results that the surface is not as rough as the results from the non-contact method would show. The assumption is that there is no correlation. However, by understanding how the surface is being measured and the process being used, the results can be adjusted to get a correlation based on similar measuring parameters.
With the blasted surface, the light from the confocal microscope gets deeper into the valleys as a result of the focal area, and the resolution of the sensor is smaller than the radius contact on the probing stylus. Thus, the optical system is apt to present readings higher than the contact system, since it sees a larger difference between the peaks and valleys. From first glance, and not understanding these differences, the natural “assumption” is that there are correlation issues. But knowing these differences, there are features within many of the confocal microscope software options to simulate a stylus tip radius. The results are as if a stylus is used with the non-contact system, and then correlation falls into place.
Of course, this should only be done as needed; when measuring surfaces with nanometer-type finishes, the higher resolution of the confocal microscope is essential for proper analysis.
Related Content
Process Control — Leveraging Machine Shop Connectivity in Real Time
Renishaw Central, the company’s new end-to-end process control software, offers a new methodology for producing families of parts through actionable data.
Read MoreTurning Fixed-Body Plug Gages Inside Out
Fixed-body mechanical plug gages provide fast, high-performance measurement for tight-tolerance holes.
Read MoreHow to Evaluate Measurement Uncertainty
Manufacturing and measurement are closely coupled. An important consideration for the use of measurement results is the associated measurement uncertainty. This article describes common metrology terms and provides an example uncertainty analysis.
Read MoreChoosing the Correct Gage Type for Groove Inspection
Grooves play a critical functional role for seal rings and retainer rings, so good gaging practices are a must.
Read MoreRead Next
Registration Now Open for the Precision Machining Technology Show (PMTS) 2025
The precision machining industry’s premier event returns to Cleveland, OH, April 1-3.
Read MoreSetting Up the Building Blocks for a Digital Factory
Woodward Inc. spent over a year developing an API to connect machines to its digital factory. Caron Engineering’s MiConnect has cut most of this process while also granting the shop greater access to machine information.
Read More5 Rules of Thumb for Buying CNC Machine Tools
Use these tips to carefully plan your machine tool purchases and to avoid regretting your decision later.
Read More







.png;maxWidth=300;quality=90)


