See How You Stack Up
“Top Shops” benchmarking data sheds light on what it takes to be one of the nation’s leading machining businesses.
Share


Would you be in a better position if your shop generated $50,000 more per CNC machine each year? What about an extra $10,000 per employee? Answers to those two questions are clear, but consider this tougher one: How do you know that those are the numbers you should be trying to hit? The most effective way is to compare your shop’s key performance indicators with those from the upper echelon of machining businesses, and our “Top Shops” benchmarking initiative enables you to do just that.
The aforementioned sales values were generated from data collected in our inaugural Top Shops benchmarking survey. The comprehensive online survey was conducted in January with help from the MPI Group, parent company of the Manufacturing and Management Performance Institutes. It was completed by 183 shops of various sizes and types, including job shops, contract shops and captive operations. The survey posed questions not only about machining and shopfloor approaches, but also business and operational practices. Our goal was to present data from the survey to help companies like yours become more competitive in the global marketplace by emulating the practices of leading discrete parts manufacturers.
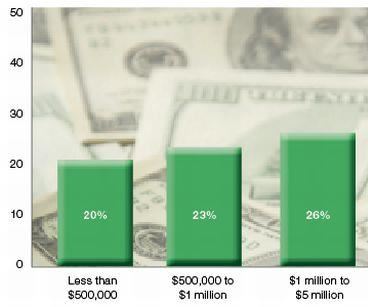
After compiling the survey data, we established the Top Shops benchmarking group. This group represents the top 20 percent of machining businesses, determined by totaling the points assigned to select business- and technology-related questions. The graph to the right shows the breakout of this year’s benchmark group in terms of gross sales. It’s interesting that small-, medium- and large-sized operations comprise this group of successful shops in nearly equal amounts.
Survey participants received a series of Summary Data Reports that provided data for each survey question. Divided into four reports, the answers were broken down by shop type (captive, contract and job), gross sales in 2010, number of parts produced that year and a comparison of Top Shops’ performance versus other shops. These reports were made available only to survey participants, but we highlight some interesting findings below so that all shops can get a sense of how they stack up against the Top Shops.
In general, the data we compiled was encouraging. Surveyed shops noted improvements in a variety of key areas, suggesting that many businesses are taking proactive strides to become more effective and efficient. This is supported by data that shows gross sales for all shops is expected to be 27 percent higher this year than in 2010 (based on the median sample value for that question). Of course, this also indicates that they envision market conditions improving in 2011. In addition, shops demonstrate improvement in critical machining metrics such as spindle utilization, machine availability, setup time, scrap/rework and first-article quality yield. Also, many responded that they will make larger investments in new CNC equipment and tooling in 2011, signifying their intent to leverage the latest machining technologies to become more competitive.
This article focuses on these and other noteworthy findings from the survey. In most cases, we use a data sample’s median value instead of the mean to represent the average response for a given question. The median is not distorted by a couple of very high or low values in a given sample. It represents the true midpoint.
Now, let’s delve into some of the findings.
Shop Profiles
Who are these shops? An assortment of machining businesses participated in our survey. Job shops (independent shops that oftentimes perform short-run and other non-repeating work) comprised the majority of respondents at 57 percent followed by contract shops (independent shops that primarily have contracts for repeating part numbers) at 34 percent. Just more than 8 percent of those surveyed were part of captive operations. Table 1, which breaks down survey participants by gross sales, offers a sense of the sizes of shops that participated in the survey.
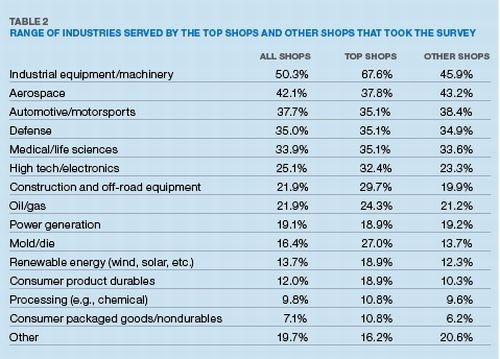
The surveyed shops serve a wide range of industries as evidenced in Table 2. However, the majority of the Top Shops—nearly 68 percent—serve industrial equipment and machinery customers, while just 46 percent of the other shops have customers in that market segment. Not surprisingly, most shops—63 percent—define their typical jobs as being low-volume and high mix. That said, the Top Shops tend to have greater breadth of product running through their facilities, and they produce a higher number of part SKUs each year (a median of 500 versus 300 for other shops). In addition, typical Top Shops have 38 active customers compared to 25 for the other shops, while all shops report having essentially four customers that represent 80 percent of their total sales.
Machining Technology
What types of machining practices occur at these shops? Not surprisingly, VMCs and horizontal turning centers topped the list of equipment used by all surveyed shops. For the most part, the scope of equipment used by both the Top Shops and the other shops was similar, save two notable exceptions. First, 40 percent of the Top Shops use HMCs versus 30 percent for the other shops. Second, 24 percent of the Top Shops use complex Swiss-type lathes compared with 11 percent for the other shops. The Top Shops also tend to have more CNC machines than the other shops, reporting a median value in 2010 of 15 units compared with 7. Plus, they seem to use more of the capacity they have available to them. When asked how many of their CNC machines produce parts in a typical week, the Top Shops said they use more than 93 percent of their machines weekly versus only 79 percent for the other shops.
As alluded to above, the survey data shows that the Top Shops invest more in capital equipment than the other shops. As a percentage of sales in 2010, the Top Shops invested 8 percent in capital equipment versus 3 percent for the other shops. However, all shops expect capital equipment spending to increase in 2011 by approximately 44 percent. The same can be said for tooling investment. The median value for tooling costs for all shops (based on 2010 sales) was 5 percent, but that figure is expected to increase by more than a third in 2011.
Responses to survey questions about capital equipment ROI were telling, and this is not solely because of the answers provided. For 2010, the Top Shops reported a median ROI of 18.5 percent compared to 17.5 percent three years prior. This figure was 10 percent in 2010 for the other shops, unchanged from 2007. What’s perhaps more telling, though, is that while all but one of the Top Shops provided figures about capital equipment ROI, only 45 of the nearly 150 other shops offered answers. This indicates that leading shops tend to be more disciplined about calculating, considering and studying such numbers than lower-performing shops.
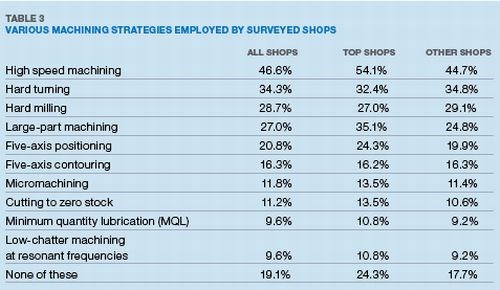
When asked about specific machining strategies that each surveyed shop employs, the replies were much the same (see Table 3) with the exception that the Top Shops are more likely to perform high speed machining and five-axis workpiece positioning as well as large-part machining. That said, approximately 24 percent of the Top Shops don’t perform any of the machining strategies listed in Table 3, suggesting that those sophisticated techniques aren’t necessarily essential for every shop to be successful. The Top Shops do, however, perform on-machine probing for tool breakage and measurement more than the other shops (43 percent versus 26 percent) as well as on-machine probing for workpiece measurement (38 percent versus 24 percent). The latter indicates that the Top Shops see value in giving up some spindle in-cut time for the chance to enable their machines to also perform inspection duties.
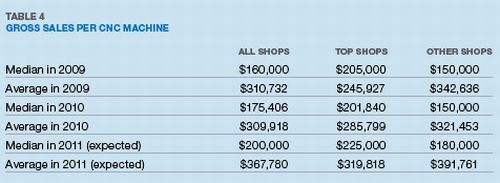
So how effective are shops at using their CNC machines? One can find out by examining gross sales per machine, as shown in Table 4. In 2010, the Top Shops reported a median gross sales per machine of approximately $202,000 versus $150,000 for the other shops. All shops expect this to increase in 2011 by a median value of 14 percent. However, the biggest jump will come from small shops with sales of less than $500,000 per year. They expect gross sales per CNC machine to increase by a healthy 34 percent in 2011.
Shopfloor Performance
How effective are shopfloor practices? All shops strive to minimize setup times, and the data shows that all the surveyed shops have improved those times in recent years (see Table 5). In 2010, the median setup time for the Top Shops was 2.5 hours versus 3 hours in 2007. For the other shops, these median times were slightly longer at 3.5 and 4 hours, respectively. On the other hand, percentages for scrap and rework have remained essentially the same over recent years for all surveyed shops: The median value for scrap and rework as a percentage of sales for all shops was 2 percent in 2010, just as it was three years ago. When looking at scrap and rework as a percentage of parts produced, however, the percentage has decreased for the Top Shops from 2.2 percent in 2007 to 1.5 percent in 2010. Conversely, the other shops reported no change over that time period with a scrap value based on the number of parts produced of 2 percent.
Machine availability, spindle utilization and overall equipment effectiveness (OEE) are all good indicators of how well shops are making use of their capital equipment. For all the surveyed shops, machine availability as a percentage of scheduled uptime increased from 80 percent in 2007 to 85 percent in 2010. However, only the Top Shops showed improvement in spindle utilization (the in-cut time as a percentage of machine uptime), improving from 71 percent three years ago to 80 percent in 2010 (see Table 6). The other shops reported spindle utilization of only 60 percent for both years, hinting that no progress has been made to improve the percentage of time their machines are in the cut. On the other hand, all shops reported better values for OEE (the product of the percentages of machine availability, quality yield and optimal rate at which the equipment operates). This figure increased for all shops from 70 percent in 2007 to 75 percent in 2010.
The survey also asked about shops’ efforts to adopt lean manufacturing principles and become more environmentally responsible with their manufacturing processes. Survey data shows that 72 percent of the Top Shops have implemented lean manufacturing in some way versus only 43 percent for the other shops. Similarly, 43 percent of the Top Shops say that environmental responsibility was either important or highly important to the success of their business compared with just 33 percent for the other shops. (See the articles under Editor's Picks at the top-right for more detail about these particular initiatives.)
Employees/Human Resources
What are shops providing to their employees? Survey data indicates that shops are performing better without adding employees. Using median values, the number of shopfloor workers that all surveyed shops employed in 2010 was essentially the same as in 2009. Plus, employment numbers for all are expected to remain the same in 2011. However, employee turnover is not as problematic for the Top Shops as it is for the other shops. Average turnover in 2010 for the Top Shops was 4.5 percent, versus 8.3 percent for the other shops. As for training, approximately one-third of all surveyed shops provide less than 8 hours of training for shopfloor workers each year while another third of shops provide 8 to 20 hours. The Top Shops provide virtually the same amount of training as the other surveyed shops.
The Top Shops pay their production employees essentially the same as other shops, too. Median hourly wages for operators, setup personnel and CAM programmers for all surveyed shops were $15, $19 and $23, respectively. What’s striking is that all shops expect total employee costs (including wages, benefits and so on) to rise significantly in 2011. While employee costs represented 25 percent of total costs for all surveyed shops in 2010, they are expected to increase to nearly 48 percent in 2011, possibly due to higher health care costs. It will be interesting to see if increasing employee costs will spur more shops to look closely at adding automation. Currently, nearly 11 percent of the Top Shops and 4 percent of the other shops use machine-tending robots.
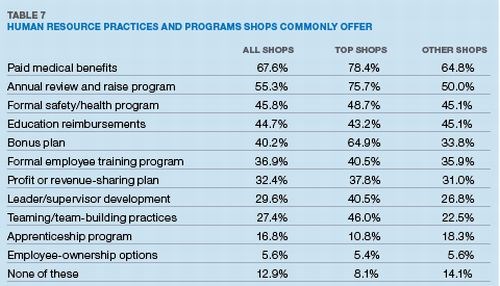
Table 7 lists the types of HR programs surveyed shops offer their employees. A much higher percentage of the Top Shops offer bonuses, annual review/raise plans, supervisor development programs and team-building exercises. What’s also interesting is that nearly 35 percent of small shops (those having gross annual sales of less than $500,000) offer none of the programs in that list.
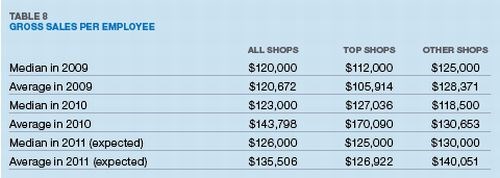
Of course, gross sales per employee is a strong indicator of overall business performance. Examining median figures, the Top Shops were able to generate approximately $127,000 per employee in 2010 versus $118,000 for other shops. However, it is primarily the small shops that expect sales per employee to rise in 2011, while larger shops actually expect it to decrease.
Two Final Indicators
How profitable are shops? Like any other business, it all comes down to the bottom line for shops. In terms of overall gross sales, growth is coming. Median gross sales in 2010 for all surveyed shops was $1.6 million, but this value is expected to increase by 20 percent to $2 million in 2011. When looking at mean values, however, this growth looks to be only 6 percent. Either way, small shops are more likely to realize the greatest boost in sales. For shops with annual sales of less than $500,000, the median sales increase expected in 2011 is 70 percent, while the mean increase is an equally impressive 50 percent. Unfortunately, larger surveyed shops don’t come close to either of those percentages.
As for net profit margin, the median value for the Top Shops in 2010 was 13 percent versus 10 percent for the other shops. This shows slight improvement for the Top Shops, which had a profit margin of 12 percent three years ago. Conversely, the other shops conveyed a profit margin decrease, albeit slight, from 10.6 to 10 percent.
Related Content
CNC Machine Shop Honored for Automation, Machine Monitoring
From cobots to machine monitoring, this Top Shop honoree shows that machining technology is about more than the machine tool.
Read MoreThe Human Impact of Machining Technology
SSP’s commitment to adopting the latest machining technology benefits not only the business, but its employees as well.
Read MoreIncreasing Productivity with Digitalization and AI
Job shops are implementing automation and digitalization into workflows to eliminate set up time and increase repeatability in production.
Read MoreRead Next
Each Shop’s One Big Thing
Top Shops tend to be good all around, achieving excellence or better-than-average ability in almost all of the activities or processes they perform, yet several technologies or strategies stand out as the most influential.
Read MoreMachining with the Environment in Mind
It’s safe to assume that most shops recognize the importance of being environmentally responsible. However, benchmarking data suggests that the effort shops put into both recycling and reducing energy consumption varies.
Read More5 Rules of Thumb for Buying CNC Machine Tools
Use these tips to carefully plan your machine tool purchases and to avoid regretting your decision later.
Read More
















.jpg;maxWidth=300;quality=90)


