Breaking News from 2021 World Machine Tool Survey
Move over, July GBI! Gardner Intelligence offers a special update on the World Machine Tool Survey in place of its typical Gardner Business Index column.
Share


Modern Machine Shop has late breaking results of the 2021 World Machine Tool Survey (WMTS). We want you to be among the first to know the implications of having more data and more actual data found in this updated read on the health of the global machine tool industry.
Cautiously optimistic. Encouraged. Just shy of a happy dance. These descriptors may apply to you after reviewing results of the 2021 World Machine Tool Survey.
What’s up? Machine tool industry economic indicators are. Not just one. Not one-half of them. Rather, all four areas measured by WMTS: production, consumption, imports, and exports, show growth from 2020 to 2021.
It may seem like it was a long time coming, but there are hints from the machine tool industry that an economic rebound is on the horizon. The broader path to recovery may have been interrupted, however, by developments around the world since the close of 2021. In any case, the 2021 WMTS results give us reason to hope that putting the worst of COVID-19 in the rearview mirror, accompanied by sustained positive trends in manufacturing, are very real possibilities in the near future.
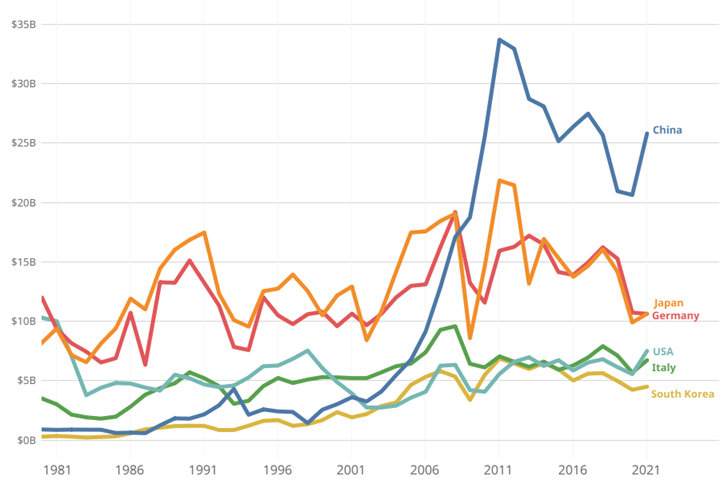
As for specifics, overall machine tool consumption increased from $70 billion in 2020 to $80 billion in 2021, while production increased from $73 billion to $85 billion on the way to recovery from dips in 2020.
Global production exceeded consumption by $5 billion. This difference may be, at least in part, a function of machine tool builders trying to get out in front of supply chain issues. The resulting surplus of machine tools may put downward pressure on prices, but global supply chain disruptions themselves are likely to put upward pressure on machine tool prices. Will one force be stronger than the other? Might they cancel each other out? Only time will tell in the absence of a crystal ball.
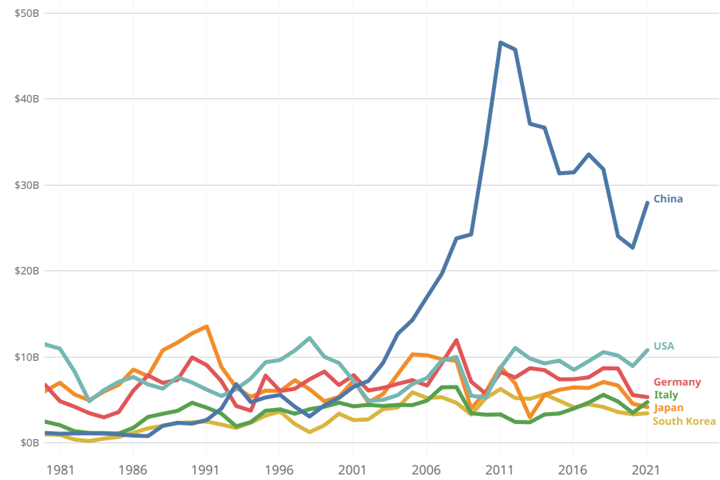
Most participating countries saw increases on all measured indicators. Recovery rates vary by country, with the United States and China serving up the most evidence. For example, 2021 marks the highest U.S. production total since 1998 and second highest since 1981, as well as the largest year-over-year increase for the U.S. in reported history. China’s production increased $5 billion from 2020 to 2021, the biggest single year increase in 10 years.
Production Updates
The six largest producers — China, Germany, Italy, Japan, South Korea and the United States — remain unchanged from 2020, with some jockeying of position.
U.S. production reached $7.5 billion in 2021, thanks to a $2 billion increase from 2020.
Japan unseated Germany’s number two position, a function of Japan’s increased production combined with Germany’s slight decrease.
Italy’s production was up, but the U.S. was up more, enabling the U.S. to swap positions and assume the number four spot.
Consumption Updates
The six largest producers are also the six largest consumers in 2021.
China, U.S. and Germany, in that order, maintained ranks on consumption from 2020 to 2021.
About the Survey
This is the 54th edition of an independent, annual survey that collects statistics from machine tool consuming and producing countries and compares them in real U.S. dollars. It is conducted by Gardner Intelligence, the research department of Gardner Business Media Inc. (Cincinnati, Ohio).
Criteria for inclusion in the report are: 1) a country has imported at least $100 million of machine tools at least one year since 2001; and 2) country data are provided or reasonable estimates can be calculated. Data are reported for 50 countries in the 2021 report.
Total import, export and production data are provided by, or estimated for, each country. Consumption is calculated by adding imports and production, then subtracting exports.
The data typically are reported in local currencies, then converted to U.S. dollars. Historic data are adjusted for inflation using the U.S. Bureau of Labor Statistics’ Producer Price Index for capital equipment. This adjustment promotes more accurate comparisons over time.
Sources of Data
Contributors include the 15-member CECIMO consortium (Brussels, Belgium) and AMT – The Association For Manufacturing Technology (McLean, Virginia).
For countries that do not report total imports and exports, data from the International Trade Centre (ITC) are used. ITC data are also used to report imports and exports at the machine tool category level for all countries.
Estimates are calculated for production when data are not provided.
Imports and exports at the machine tool category level typically sum to numbers less than or equal to the corresponding totals reported. Differences are driven by reporting the top five, rather than all eight machine tool categories.
In rare instances, imports and exports at the machine tool category level sum to numbers higher than the corresponding totals reported, likely a function of the machine-tool-category level data including parts and components that are not included in totals. It can also be an artifact of using different data sources.
Definitions
This survey is based on actual shipments of new machine tools from the factories in which they are produced. Shipments lag orders to varying degrees across machine types. On average in the United States, orders lead shipments by four to five months. That is likely a common lead time for other countries as well.
A machine tool is usually defined as a power-driven machine, not portable by hand and powered by an external source of energy. It is designed specifically for metalworking either by cutting, forming, physical-chemical processing or a combination of these techniques.
Machine tools traditionally are broken down into two categories: metalcutting and metal forming. Metalcutting machines typically cut away chips or swarf and include (but are not limited to) broaching machines, drilling machines, EDM units, lasers, gear-cutting machines, grinders, machining centers, milling machines, transfer machines and turning machines, such as lathes. Metal-forming machines typically squeeze metal into shape and include (but are not limited to) bending machines, cold-heading machines, presses, shears, coil slitters and stamping machines.
Data presented in the World Machine Tool Survey are solicited for metalcutting machines (codes 8456-8461 under the Harmonized Tariff System) and for metal-forming machines (8462-8463), and are solicited for complete machines only, not including parts or rebuilt machines.
Related Content
Metalworking Activity is Nearing a Full Year of Contraction
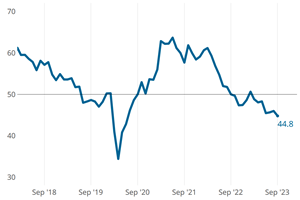
Metalworking activity has contracted since October of 2022.
Read MoreMetalworking Activity Stabilizes in July
July closed at 44.2, which interrupts what had been three months straight of accelerating contraction.
Read MoreMetalworking Activity Contracted Marginally in April
The GBI Metalworking Index in April looked a lot like March, contracting at a marginally greater degree.
Read MoreMetalworking Activity Starts Year With Slowing Contraction
The GBI: Metalworking welcomed the new year with slowed contraction of components for the second month in a row.
Read MoreRead Next
Building Out a Foundation for Student Machinists
Autodesk and Haas have teamed up to produce an introductory course for students that covers the basics of CAD, CAM and CNC while providing them with a portfolio part.
Read More5 Rules of Thumb for Buying CNC Machine Tools
Use these tips to carefully plan your machine tool purchases and to avoid regretting your decision later.
Read MoreRegistration Now Open for the Precision Machining Technology Show (PMTS) 2025
The precision machining industry’s premier event returns to Cleveland, OH, April 1-3.
Read More


