Machine Tool Data Analysis Identifies Effective Setup Tactics
Thanks to the MTConnect standard, it is easy to create a timeline of a machine’s activities and use it to discover ways for improving operations. One example is how to reduce setup time.
Share


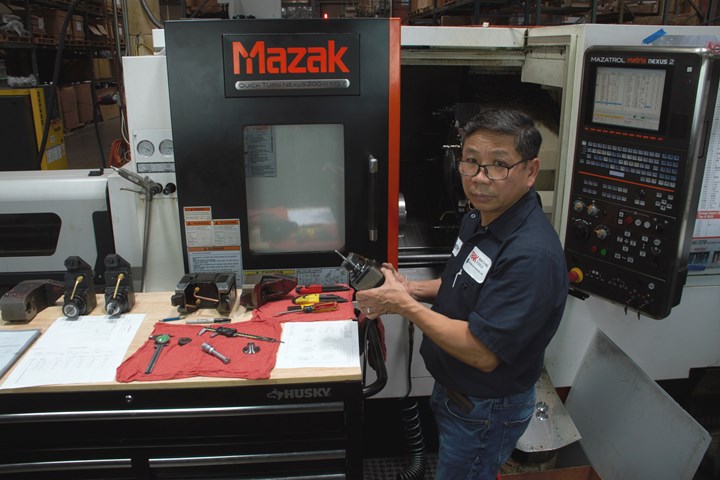
One of our best operators, Tim has good habits that make his setups efficient and effective, thus maximizing productivity of this Mazak MYS multitasking machine. Here, he is checking a live tooling fixture before mounting it in the turret. Photo Credit: Southwestern Industries
Trak Machine Tools, a division of Southwestern Industries, is a provider of machine tools designed for high-mix, low-volume production. It has a small captive machining facility at its headquarters in Rancho Dominguez, California, one which is also characterized by high-mix, low-volume production. This facility has a capable machine shop that includes vertical machining centers, CNC lathes, horizontal machines, mill-turns and grinders. These machines support production of the company’s line of toolroom vertical mills and horizontal lathes, as well as the company’s signature ProtoTrak controls, which are distinguished by their conversational programming capabilities.
As Trak’s VP of operations for 40 years, I have been involved in managing this machining facility and keeping it as productive as possible. In this position, I know firsthand the challenges of watching over diverse machine tools and 20 shop personnel. In a typical week, about 50 different jobs pass through this shop.
With my engineering background and shop management experience, I was keenly interested in digital developments which promised to make it easier to use data as the basis for making sound decisions about machining processes and overall operations in a shop like this. This interest prompted me to join the team of volunteers helping to develop and expand the application of the MTConnect data standard for machine tools. This standard specifies the open-source, royalty-free communications protocol based on XML and HTTP Internet technology for real-time data sharing between shopfloor equipment such as machine tools and computer systems. MTConnect provides a common vocabulary with standardized definitions for the meaning of data that machine tools generate, making the data interpretable by software applications. Currently, I am the vice-chair of the MTConnect Standards Committee and chair of the Robotic and OPC-UA Companion Specification working groups.
Today, I am serving Trak as chief technology officer to develop machine data for practical use by our customers. In particular, I focus on uses of machine data for small operations in which a full-blown machine monitoring system would add more networking infrastructure and system overhead than necessary. The enabling technology I was eager to take advantage of was MTConnect because this standard is designed to format machine data so it can be captured for analysis.
I wanted what many of our customers also want — a simple but effective way to use machine data for identifying opportunities to make incremental improvements. The tool I created for this is a timeline derived from data generated by the machine’s control unit and visualized using a normal web browser. Data generated in the MTConnect format is easiest to extract and organize for this purpose, although with some extra effort, machine tool builders can leverage data supplied in the machine’s native format.
A closer look at this digital tool highlights the value of a data-driven approach to monitoring and improving machine operations. It shows how even basic, time-stamped data such as program run time and part count can reveal useful insights. In my case, we are using this tool to pinpoint and track the operator on our team who is the most efficient at one particular aspect of machining operations: setup.
My intent is to document this operator’s performance and use it as a benchmark. By identifying him and investigating his methods and practices, we have been able to pass them on to other operators, who we simply ask to follow his example. Having data to observe and measure the resulting improvements validates this non-intrusive, non-coercive campaign to reduce setup time, increase machine uptime and avoid errors or other quality issues.
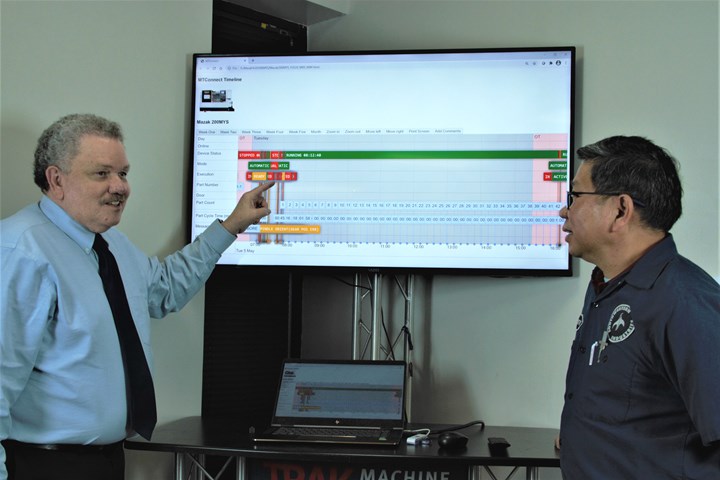
By pointing to the specific setup events that seemed the most significant, I easily could engage in a meaningful conversation with Tim. This record of events was an easy but precise way to jog his memory for an explanation of his exact procedures at the moment. Tim’s input was essential. It gave me a full picture of the skill and attentiveness he applied — insights no monitoring system can deduce from data alone. Photo Credit: Southwestern Industries
Meet Tim
Every shop can single out the employees who are the best at running their machines. Typically, they have the lowest scrap rate and the fastest throughput when it comes to moving jobs through the shop. For the sake of his privacy, I’ll call one of those employees Tim. Tim is a real person in our shop and he is justly proud of his work. To praise Tim, you must praise his work. He doesn’t seek a lot of attention otherwise.
Like most shop managers, I’ve asked myself, “Where can I find more people liked Tim?” A better question, I found, is “How can we make other people in the shop more like Tim?”
I wanted to answer this question with neutral objectivity so my decisions would not appear to be biased by personality or favoritism. To do this, I needed data — facts and measurements that I could track and verify. I needed the credibility that data provides not only to convince other operators to follow procedures more like Tim’s, but also to have my own self-assurance that we were moving in the right direction. I believed that focusing on machine data would keep attention on procedures and results rather than on comparisons of personal behavior.
To get started, I picked a simple situation with one machine Tim operates. The amount and type of data to collect was manageable. More important, what the data showed was relatively easy to discern. I expected this visualization to lead to insight, and was not disappointed.
The Tool
As I said before, my “tool” is simply a timeline of the selected machine’s activities. Because the machine tool of interest (a mill-turn with live tools and a bar feeder) has a CNC with the option to generate data in the MTConnect format, I could set it to sample the data every five seconds and record it in a database. This database is simply a standard text file formatted for viewing in a freely downloadable JavaScript timeline component. As a text file, one month’s worth of data from one machine consumes about 1.5 MB of memory in our server.
I created a custom display that enabled me to chart an expandable timeline displayable by month, week or day. With this tool I can see a full month of activity or zoom all the way down to a second. I can capture events such as when a new part was loaded into the machine, when it was running, when it stopped running or was interrupted, and when it transitioned from setup to production. The image below is an example, showing loading in a new program, setting up the machine and the subsequent production run that all together lasted 3 days, 13 hours and 37 minutes. I will explain later why zooming in to examine specific incidents and patterns is important.
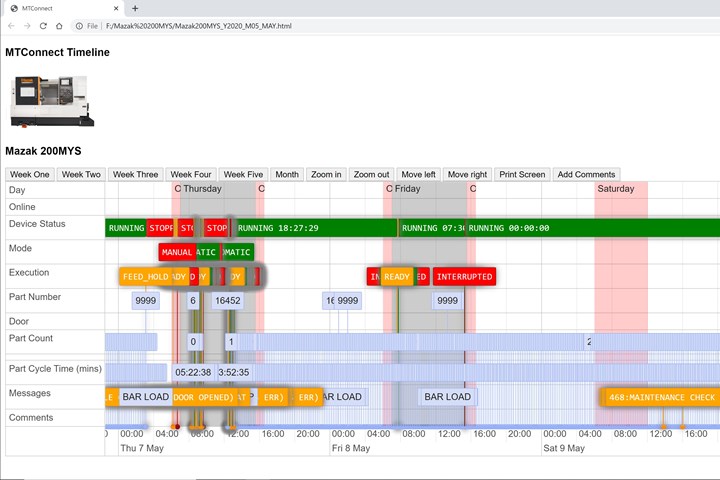
My digital tool for capturing what is happening during Tim’s setups is a timeline consisting of a record of sequential events that the machine’s control unit generates in the MTConnect format in real time. I carefully select event to give me the data I need for my own inspection and interpretation. This screen shows an overview of the three days one certain job was running.
Photo Credit: Southwestern Industries
To understand what the machine was doing and, by implication, what made Tim’s activities so effective, I needed to capture only a few types of data that the CNC generated. These types included the machine’s mode (manual or automatic), its status (running or stopped), the program number that is running and the part count (which could be used to determine cycle time of individual parts). The types of machine data appear in the extreme left column in the screen shown in the image above.
Although I call this custom display an application, I did not do any original computer programming. There was no need to create code for applying algorithms to the machine data. All I wanted to do was see what the machine was doing. That is why I call this “machine data in the raw.” The data is not processed, so to speak, to create various types of reports, trigger alarms, interface with other shop programs and so on.
A variety of commercial systems for this more advanced level of machine data collection, analysis and reporting are available on the market. My timeline application is not meant to be a substitute for this kind of machine monitoring, although my simple creation is compatible and could work alongside a full-blown, shop-wide monitoring system.
The chief value of my tool is simply as an aid to visualization. It lets me see an accurate overview of a process based on facts the machine records. However, this overview is only part of the complete picture. The rest of the information I needed had to come from Tim. The framework for this “collaborative investigation” was the record of machine data. In our discussions of particular happenings and the reason behind them, it was always clear exactly what we were talking about. As a result, his explanations made more sense to me because the data gave them a precise context. This clarity was especially valuable because English is Tim’s second language and miscommunication could have held us back.
This combination of data and discussion helped us learn a lot about best practices and how to pass them on to other members of the shop team.
Focus on Setups
Setups are some of the most difficult tasks in a machine shop, especially on a complex machine tool such as a mill-turn. A good machine operator handles a setup with efficiency and effectiveness. They perform procedures with few delays to find tooling components or measurement devices, and perform these procedures correctly, thoroughly and promptly, as a sloppy or hasty setup may cause out-of-spec features or other quality issues. Of course, poking along a setup with no sense of urgency is simply unproductive downtime.
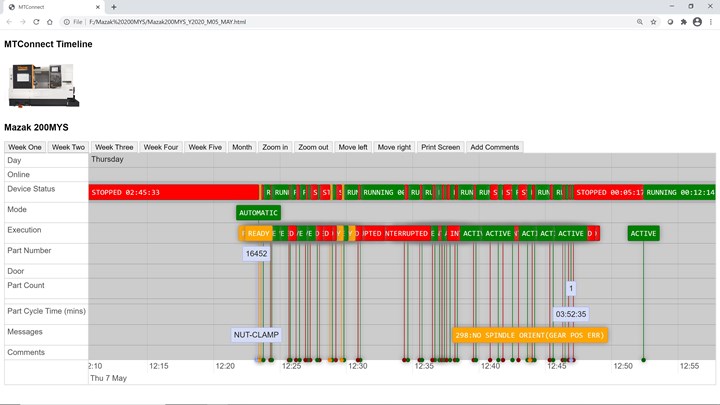
One of the benefits of the timeline is the ability to zoom in on one particular period for a close look at the recorded events and the related activities implied by these events. An examination of the timeline during setup was my main source of insight into Tim's efficiency. We could look at a minute-by-minute, even second-by-second, view of setup activities. Photo Credit: Southwestern Industries
Tim’s setups always had the right balance. My attempts to observe his setups and take notes as he worked were not particularly successful. The sequence of steps and time needed for each step was virtually impossible to determine this way. The machine data timeline helped solve this problem because the machine records actions in the order they occur, with time stamps to capture when something started and when it stopped. For example, with this timeline, I could zoom in to see when a new program was loaded, then see a series of program starts and stops during the first hour of operation. This is the view shown in the image above.
Zooming out, I could look at how the production run extended over normal shift hours and unattended hours (lights-out) at night.
Closing the Loop
The next step was to get the rest of the story from Tim. Having a hard copy of the pertinent periods of the timeline enabled me to sit down with him and get an account of his actions at specific dates and times. In this case, we zeroed in on the period when the machine was being started and stopped multiple times, as shown in the image below.
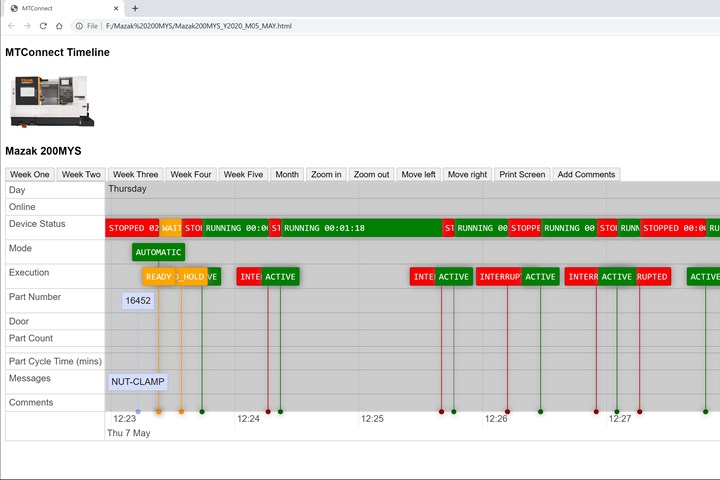
A review of the setup period showed Tim starting and stopping the machine numerous times in rather quick succession. Tim was diligently conducting stop checks so the cutting tools would be on the correct side of the tolerance limits before he started the job. These stop checks and offset adjustments help ensure that parts will be in spec during the job’s three-day run. Photo Credit: Southwestern Industries
Tim’s explanation was to the point. He was loading new tools into the turret and machining sections of the part to ensure that the offset would allow the tool to run for three days nonstop while producing parts within the specified tolerance. He would then use a micrometer or caliper to check feature dimensions and compare them to the nominal offset for his adjustment.
One insight I gained was that Tim’s experience with the machine was critical. He knew which tools in which turret stations required closer checking then others. I gained another insight from observing Tim’s meticulously consistent use of the measuring devices to minimize variations that could influence his offset value adjustments.
There are other topics yet to be explored. Because Tim is effective with his setups of the mill-turn machine, he is able to run as many as three secondary machines. I believe that the common thread with all of his machines is Tim’s good setup habits. Although good procedures can be reviewed and reinforced, developing a habit of applying them is a different training challenge. However, I have a framework for moving ahead.
With detailed MTConnect data, I can identify subjects that might go unnoticed when operators respond to the question of how they do their jobs. Meeting with an operator like Tim brings out details that might have been overlooked with machine data alone. With both, Ican develop comprehensive training programs along with achievable time standards as defined by reliable data from mybest operators.
We plan to expand on this tool and make it more accessible to others in our shop and in our other manufacturing areas. Our strategy is for employees to challenge themselves, knowing what is already possible.
About the Author: Tom Copeland is VP of operations for Southwestern Industries. In addition to promoting MTConnect and OPC-UA, Tom participates in Microsoft’s Southern California User Group, where he has made presentations on the Internet of Things (IoT) and Industry 4.0.
Related Content
Machine Tool Drawbar Made With Additive Manufacturing Saves DMG MORI 90% Lead Time and 67% CO2 Emission
A new production process for the multimetal drawbar replaces an outsourced plating step with directed energy deposition, performing this DED along with roughing, finishing and grinding on a single machine.
Read MoreCustom Workholding Shaves Days From Medical Part Setup Times
Custom workholding enabled Resolve Surgical Technologies to place all sizes of one trauma part onto a single machine — and cut days from the setup times.
Read MoreInverting Turning and Five-Axis Milling at Famar
Automation is only the tip of the iceberg for Famar, which also provides multitasking options for its vertical lathes and horizontal five-axis machine tools.
Read MoreGrob Mill-Turn Machining Center Provides Flexible Performance
The G550T mill-turn universal machining center offers optimized milling and turning performance for a broad range of part materials in one setup.
Read MoreRead Next
Setting Up the Building Blocks for a Digital Factory
Woodward Inc. spent over a year developing an API to connect machines to its digital factory. Caron Engineering’s MiConnect has cut most of this process while also granting the shop greater access to machine information.
Read MoreRegistration Now Open for the Precision Machining Technology Show (PMTS) 2025
The precision machining industry’s premier event returns to Cleveland, OH, April 1-3.
Read More5 Rules of Thumb for Buying CNC Machine Tools
Use these tips to carefully plan your machine tool purchases and to avoid regretting your decision later.
Read More







.jpg;maxWidth=970;quality=90)