Understanding the Machine Tool Industry’s Ups and Downs
In recent years, China’s patterns of consumption have had an exaggerated effect on global cycles.
Share


Boom and bust. Boom and bust. If you have been involved in metalworking and the machine tool industry long enough to have endured and persevered through several of these boom-bust cycles, then you probably have this sense that the difference between the boom and the bust has increased over a time. In other words, the peaks have seemed higher and the dips deeper with each passing cycle.
Well, this is not all in your head or your gut. This impression is real.
I have spent the last 10 years attempting to forecast the metalworking industry, particularly machine tool consumption. It didn’t take me long to understand that metalworking and machine tools are the classic example of a cyclical, boom-bust industry. Although I was armed with that knowledge and had the data to back it up, I was nonetheless surprised when I took a fresh look at the long-term global machine tool consumption data from Gardner Business Intelligence’s latest World Machine Tool Survey.
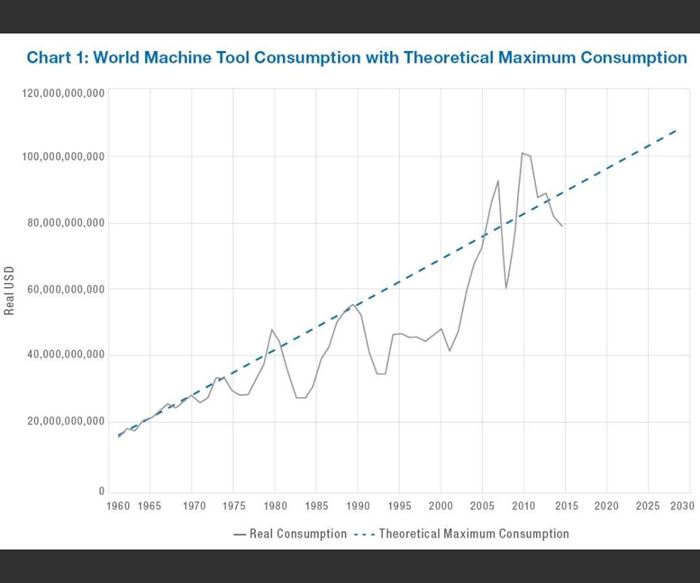
Chart 1 in the slideshow at the top of this article shows world machine tool consumption with a theoretical maximum consumption trend. Notice the gray line. It represents global consumption in U.S. dollars, adjusted for inflation. This line indicates that the increase in global consumption over time is caused by more countries becoming industrialized and not the weakening of the U.S. dollar through inflation.
From 1960 to 1970, global machine tool consumption increased in an almost perfectly straight line. To almost anyone in the metalworking industry today, an entire decade of straight-line growth is almost beyond imagination. However, the boom-bust cycle that seems normal today did not begin until 1971.
Generally, a complete cycle in machine tool consumption has taken 10 years from peak to peak. In recent years, when interest rates were lowered to nearly zero (and in some cases below zero), the cycle periods became less regular.
In fact, the height of peak consumption in those cycles increased over time, even though the periodicity (peak-to-peak time) did not. The dotted blue line in this chart represents a theoretical maximum consumption of machine tools. It is based on the straight-line growth of recorded machine tool consumption from 1960 to 1970. In other words, we can suppose that the straight-line growth during this period was the natural or “organic” pattern for machine tool consumption and that the forces behind it were normal and steady (at least in theory). Given this assumption, machine tool consumption can be theorized to “max out” at points on this line in the period after 1970 as a logical supposition. This theoretical maximum gives us a useful reference for examining the actual consumption results.
In fact, the peaks of machine tool consumption generally fall on that line. We had no such peak in the late 1990s (thank you, dot-com bubble), and we dramatically overshot the theoretical maximum machine tool consumption in 2008 and 2011-2012 (more on that later).
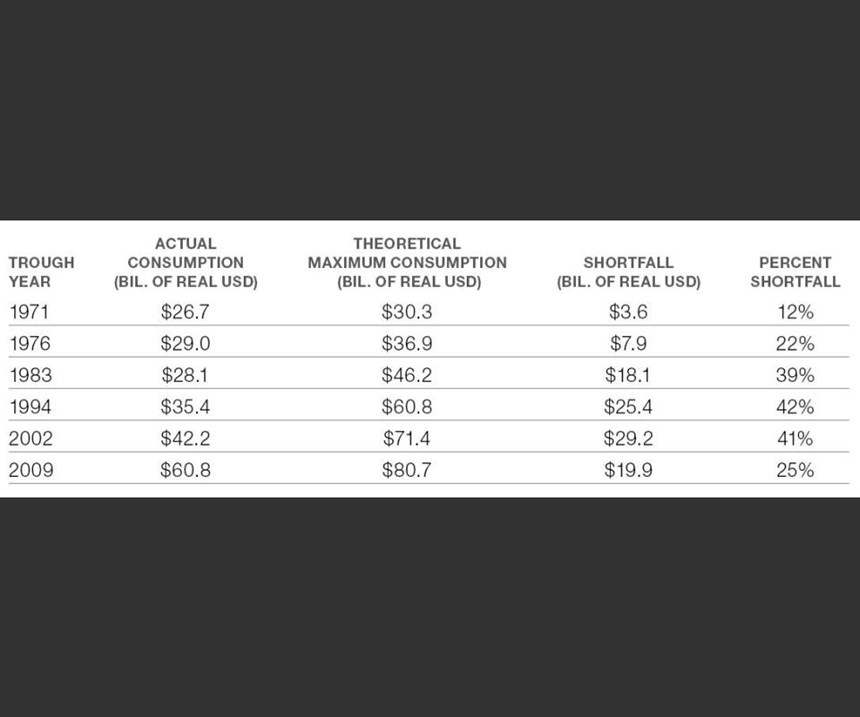
This theoretical maximum can be compared to the bottom of each machine tool cycle. For example, in 1971, the theoretical maximum machine tool consumption was slightly more than $30.3 billion, but actual machine tool consumption was only $26.7 billion. So, at the trough of the cycle, consumption fell short of the theoretical maximum by $3.6 billion, or 12 percent. History shows that, cycle after cycle, this shortfall has widened.
Table 1 in the slideshow at the top of this article shows that the cycles were indeed getting worse, both in terms of the absolute distance from theoretical maximum and the percentage below the theoretical maximum. Note that, even though the size of the shortfall gap grew in 2002, the shortfall represented a slightly smaller percentage of the theoretical maximum than in 1994. Then, in 2009, the shortfall decreased significantly, and with it, the percentage of the theoretical maximum naturally decreased as well.
The fact that the last two dips in machine tool consumption have not been as severe and the fact that machine tool consumption dramatically overshot the theoretical maximum in 2008 and 2011-2012 are related. Both developments were caused by China’s influence on the global market.
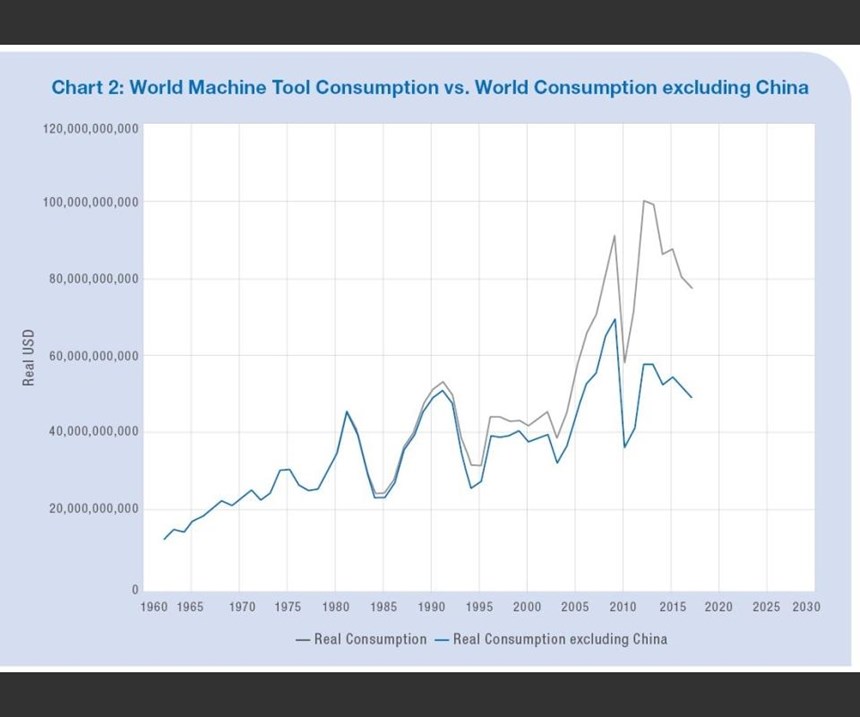
The gray line in Chart 2 shows world machine tool consumption, while the blue line shows world machine tool consumption with figures from China dropped from the calculation. Notice that, until the mid 2000s, there was not a significant difference between the two lines. That’s because China only accounted for no more than 15 percent of global consumption before that period. By 2011, China’s machine tool consumption accounted for 40 percent of the global total.
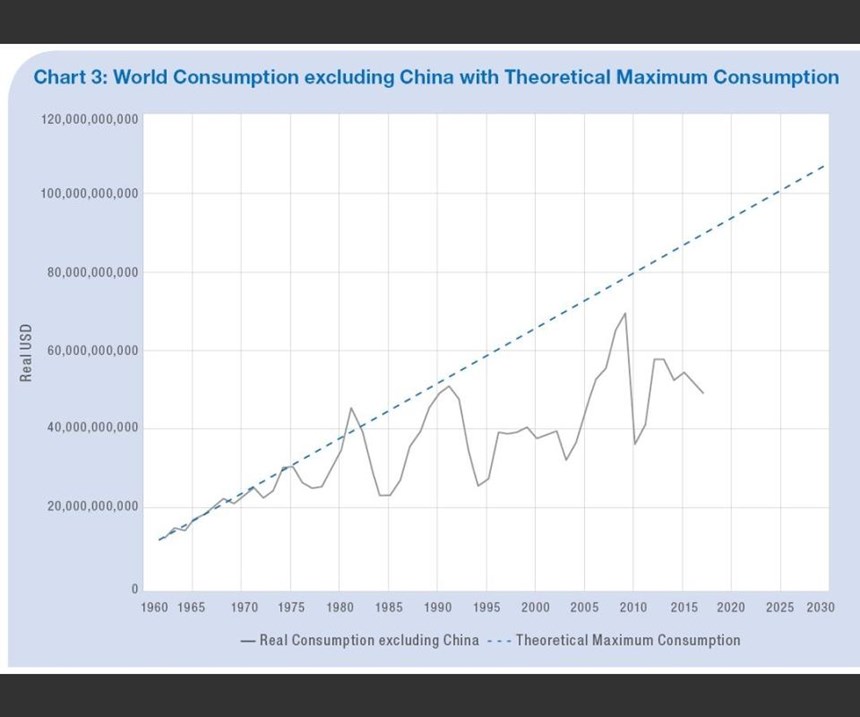
Therefore, it seems clear that the influence of China’s suddenly huge appetite for machine tools is the reason the troughs have been less severe and the peaks have been higher than expected. Chart 3 shows world machine tool consumption and the theoretical maximum machine tool consumption without including numbers from China. Through 1990, the peaks continued to hit the line while China still represented a small percent of global consumption. Then, in 2008, instead of dramatically overshooting the theoretical maximum, as might be expected, peak consumption fell well short of this line. Missing this level had never happened before. Likewise in 2009, the trough is much deeper both in an absolute sense and in comparison to the theoretical maximum. Instead of the expected $19.9 billion shortfall, the shortfall in global machine tool consumption widened to $41.1 billion, a figure much larger than in 1994 and 2002. And, without the numbers from China, the percent shortfall increased to 51 percent from 25 percent.
All of the factors that help explain why China’s surge in machine tool consumption had this effect may be impossible to identify. However, I believe that two known factors provide a reasonable explanation.
First, extremely low interest rates enabled global manufacturing companies to build new factories anywhere in the world in order to exploit low labor costs. Near-zero interest rates meant that financing new capital equipment was virtually free. So why not put that new capital equipment where labor costs were relatively low compared to Western manufacturing countries? As a result, low global interest rates magnified China’s machine tool consumption over that from any other country.
Second, more than any other country in the world, China represents a distinctly two-sided, yet lop-sided, machine tool market. High-end manufacturing with high-end machine tools is one side. Much of this capability is concentrated in the electronics and automotive sectors. In contrast, the other side of the market consists of low-end, even manual, machine tools. This side of the market is much larger than the high-end side, and it is this lopsided low end of the market that made it appear that the troughs in global machine tool consumption were less severe. It also is this low end of the market that made it appear that global machine tool consumption was overshooting its theoretical maximum.
This is not the end of the story. Simply taking China’s machine tool consumption from the calculations does not lead to an entirely accurate analysis. The high-end manufacturing taking place in China represents a growing percentage of the Chinese metalworking and machine tool industry. One way to capture the size of this high-end industry is to focus on Chinese imports of machine tools. It stands to reason that these imports are more sophisticated machines being installed by global manufacturers and high-end Chinese job shops.
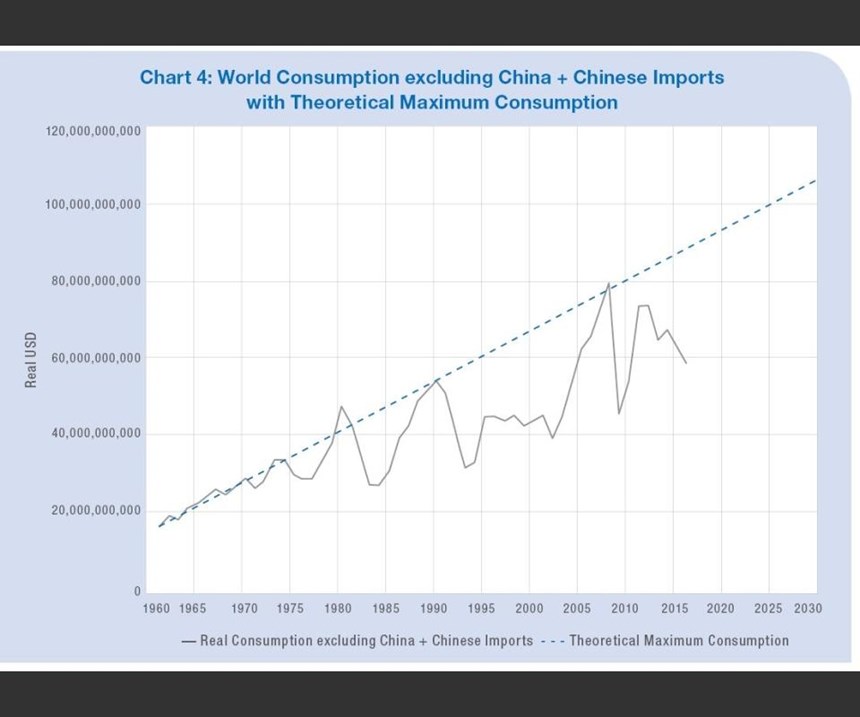
Chart 4 has insights to offer here. The gray line shows global machine tool consumption with only Chinese machine tool imports included in the data. It is significant that this method of analysis shows that global machine tool consumption falls almost exactly as expected on the line of the theoretical maximum. Therefore, true global machine tool consumption falls somewhere between the gray and blue lines of chart 2.
How does this understanding shape our outlook for the future of world machine consumption?
Chart 4 shows that global machine tool consumption in 2016 was $30.1 billion, or 33 percent below the theoretical maximum. This shows that the global manufacturing industry has not yet recovered from the great recession of 2008 to the extent expected. I forecast that global consumption will increase in 2017, even though many major national economies are still working through significant debt issues.
“The Fourth Turning,” an excellent book on long-term cyclical forecasting by William Strauss and Neil Howe, describes a theory that I believe applies to machine tool boom-bust cycles. Based on this book’s theory, the current cycle in our industry should bottom out between 2020 and 2025. Accordingly, we should see a dip in global machine tool consumption during those years.
Ultimately though, this dip may not be much deeper than current global machine tool consumption. In the last few cycles, the troughs in machine tool sales have been bottoming out at about 40 percent below the theoretical maximum. Based on a theoretical maximum consumption of $95.3 billion in 2020, the low point of global consumption would be about $57.2 billion.
Once a cycle bottoms out, machine tool consumption tends to grow for six or seven years. If we hit bottom in 2020, then we should hit the next peak between 2025 and 2030. Based on the trend that began in 1960, we can expect machine tool consumption to peak somewhere near $100 billion between 2025 and 2030.
Of course, these expectations are speculative. Many unforeseeable events may alter the situation. Nevertheless, insights into the long-term growth trend in machine tool consumption, the cyclical nature of the industry and what is happening in China can help us understand these shifts and their implications as they occur.
About the Survey
This is the 51st edition of an independent annual survey that collects statistics from machine tool consuming and producing countries and compares them in real U.S. dollars. It is conducted through the research department of Gardner Business Media Inc. (Cincinnati, Ohio) by Steve Kline, director of market intelligence. Data for this report comes from research conducted by Gardner Business Intelligence.
Traditionally, Gardner collected actual or estimated data on production, exports and imports from 26 countries. However, beginning with the 2015 survey, actual import and export data were included for every country that imported at least $100 million of machine tools in at least one year since 2001. This change added 34 more countries to the overall survey. For these additional countries, production was estimated, although in a few instances actual production data was found on government websites.
Consumption is calculated by adding imports to and subtracting exports from production figures. The data typically are reported in local currencies, then converted to U.S. dollars. After this conversion, all of the data in this latest survey also were adjusted for inflation using the Bureau of Labor Statistics’ Producer Price Index for capital equipment. This adjustment promotes a more accurate historical comparison.
Sources of Data
Special assistance came from the 15-member CECIMO consortium (Brussels, Belgium) and AMT—The Association For Manufacturing Technology (McLean, Virginia). Also, for countries that did not report, import and export data was gathered from the International Trade Centre (intracen.org).
Definitions
A machine tool is usually defined as a power-driven machine, not portable by hand and powered by an external source of energy. It is designed specifically for metalworking either by cutting, forming, physical-chemical processing or a combination of these techniques.
Machine tools are traditionally broken down into two categories: metalcutting and metal forming. Metalcutting machines typically cut away chips or swarf and include (but are not limited to) broaching machines, drilling machines, electrical-discharge machines, lasers, gear-cutting machines, grinders, machining centers, milling machines, transfer machines and turning machines such as lathes. Metal-forming machines typically squeeze metal into shape and include (but are not limited to) bending machines, cold-heading machines, presses, shears, coil slitters and stamping machines.
Data presented in the World Machine Tool Survey are solicited for metalcutting machines (codes 8456-8461 under the Harmonized Tariff System) and for metal-forming machines (8462-8463), and are solicited for complete machines only, not including parts or rebuilt machines.
Exchange Rates
All data reported in domestic currencies are translated into U.S. dollars using the average daily exchange rate for the year (not the end-of-year rate) as reported at Moody’s Analytics. All analysis is done in real U.S. dollars.
Shipments vs. Orders
In addition to contributing statistics to this survey, many countries also track orders for new machine tools. These are, by their nature, different sets of numbers, and they may or may not be related. This survey is based on actual shipments of new machine tools from the factories in which they are produced. In contrast, the various order compilations in individual countries around the world are based on bookings for machines that will be shipped in the future. The time lag between these two events can vary greatly. An in-stock lathe might be shipped one day after the order is placed, whereas a complex engine-machining line might take a year to be delivered after the order has been received. On average in the U.S., orders lead shipments by four to five months. That is likely a common lead time for other countries as well.
Related Content
How to Determine the Currently Active Work Offset Number
Determining the currently active work offset number is practical when the program zero point is changing between workpieces in a production run.
Read MoreBallbar Testing Benefits Low-Volume Manufacturing
Thanks to ballbar testing with a Renishaw QC20-W, the Autodesk Technology Centers now have more confidence in their machine tools.
Read MoreHigh RPM Spindles: 5 Advantages for 5-axis CNC Machines
Explore five crucial ways equipping 5-axis CNC machines with Air Turbine Spindles® can achieve the speeds necessary to overcome manufacturing challenges.
Read MoreInside a CNC-Machined Gothic Monastery in Wyoming
An inside look into the Carmelite Monks of Wyoming, who are combining centuries-old Gothic architectural principles with modern CNC machining to build a monastery in the mountains of Wyoming.
Read MoreRead Next
5 Rules of Thumb for Buying CNC Machine Tools
Use these tips to carefully plan your machine tool purchases and to avoid regretting your decision later.
Read MoreSetting Up the Building Blocks for a Digital Factory
Woodward Inc. spent over a year developing an API to connect machines to its digital factory. Caron Engineering’s MiConnect has cut most of this process while also granting the shop greater access to machine information.
Read MoreBuilding Out a Foundation for Student Machinists
Autodesk and Haas have teamed up to produce an introductory course for students that covers the basics of CAD, CAM and CNC while providing them with a portfolio part.
Read More
.JPG;width=70;height=70;mode=crop)
