Share



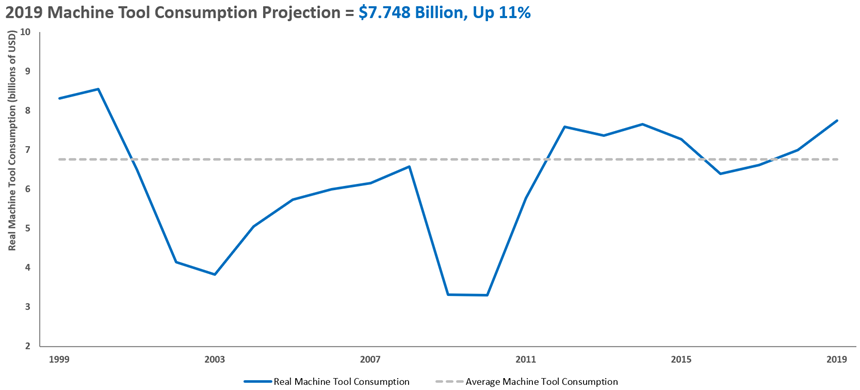
The 2019 Capital Spending Survey projects accelerating growth for the machine tool market next year. This latest report from Gardner Intelligence, the research arm of Modern Machine Shop’s publisher, Gardner Business Media, sees machine tool consumption increasing 11 percent to $7.748 billion in 2019. (See chart 1.) This follows increases of 3 and 6 percent in 2017 and 2018, respectively. In 2018, machine tool prices rose and delivery times lengthened. Given the planned spending by machine shops detailed in the report, prices are likely to climb higher and delivery times will remain lengthy.
Answering the question about what is driving the accelerating growth, higher prices and longer delivery times of machine tools is complex, but a good place to start is with the old economics maxim: “Prices are set at the margin.” This important concept explains supply and demand and, in this case, machine tool prices.
Any market, including the machine tool market, has a core set of buyers. Typically, these buyers make purchases for strategic reasons regardless of economic conditions. Other buyers move in and out of the market based on some criteria they follow. Reasons for a marginal buyer to enter the market include new orders, a growing backlog of orders, insufficient capacity to take on new work, or a need to replace a machine that often breaks down. These buyers are called marginal simply because they operate on the fringes, rather at the core of the market.
In economics, the term marginal implies “additional,” so a marginal buyer is one added to the core set of buyers. Because these core buyers make purchases regardless of economic factors, the marginal/additional buyers have the greatest influence on supply and demand, which means they have the greatest influence on prices.
Who Are These Marginal Buyers?
The marginal machine tool buyer is best identified by facility size. In the metalworking industry, large facilities—those with more than 100 employees—typically represent the core set of buyers. These companies have the volume of work and financial resources to consider purchasing new machine tools almost all the time. They also spend strategically, such as when a new product has been launched or a cost-reduction program has been initiated.
Conversely, small metalworking facilities—those with 100 or fewer employees—tend to buy machine tools because of an immediate need. Lacking the financial resources of larger facilities, small shops typically buy sporadically and only when they have cash or profits to spend. In fact, the smaller the facility, the more likely it fits this pattern. Because they tend to make less frequent purchases, small metalworking facilities represent the marginal buyers. As a result, their demand exerts the highest influence on machine supply and impacts machine-tool pricing the most.
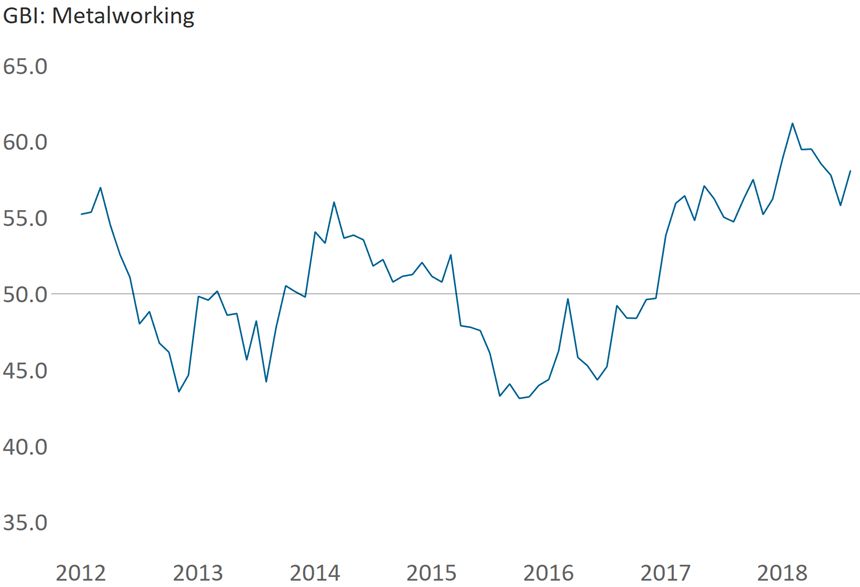
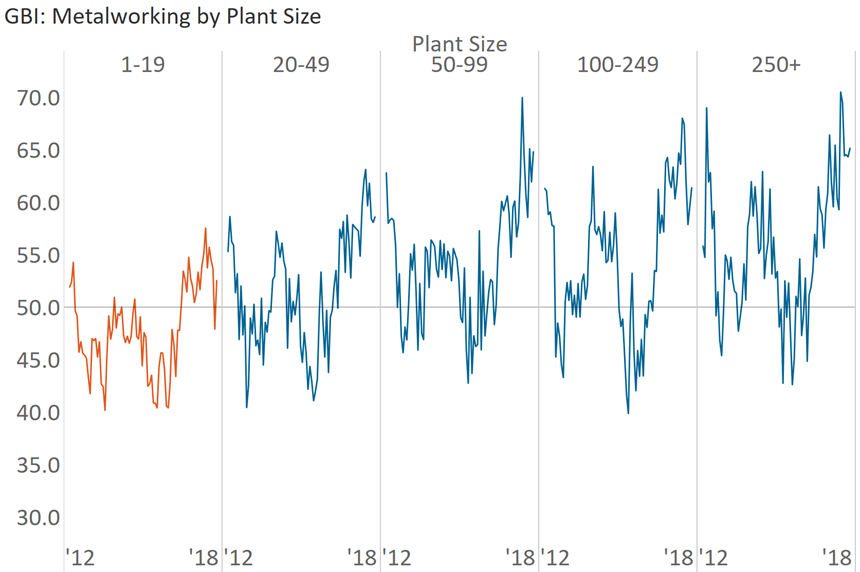
Data from the Gardner Business Index (GBI) and the 2019 Capital Spending Survey by Gardner Intelligence support this theory. The GBI: Metalworking (the economic index for metalworking companies) indicates that the industry has grown for most of the past six years, but the duration and rate of growth was not uniform across all shops (as shown in chart 2). Breaking down the Index by plant size shows that the past six years in the metalworking industry were very different depending on facility size (see chart 3).
On average, the largest shops—those with more than 250 employees—grew for most of the past six years. In fact, for most of that time, the growth rate was quite strong. However, in the same period, the story for small shops changes. The smallest shops—those with fewer than 20 employees—typically contracted for most of those years. From April 2012 to December 2016, shops with fewer than 20 employees experienced only two months of growth. Not until 2017 and 2018 did the population of small shops record consistent growth, although their growth rate was much slower than that of larger facilities.
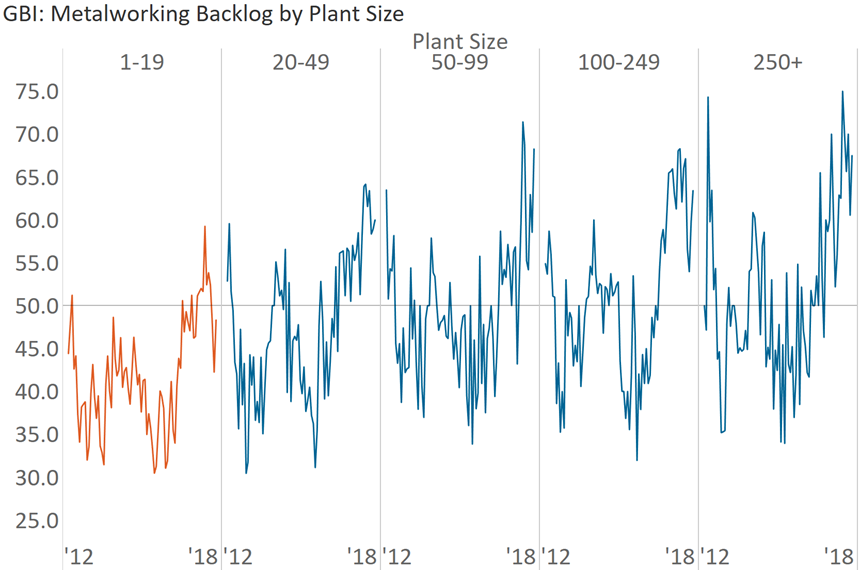
The backlog growth trends by facility size were similar, but were worse for small shops (see chart 4). Larger facilities experienced fairly robust growth in backlogs in the last six years, while smaller shops had no growth in backlogs until late 2017 or early 2018. Following such trends in backlogs is important because they are an excellent leading indicator of capacity utilization. In turn, capacity utilization is one of the best leading indicators of machine tool consumption.
The GBI: Metalworking also indicates that larger shops were likely in the market for machine tools throughout 2012 to 2018. Conversely, smaller shops, particularly those with fewer than 20 employees, were not likely to be in the market for machine tools until 2017. In fact, they were more likely to have entered the market in 2018.
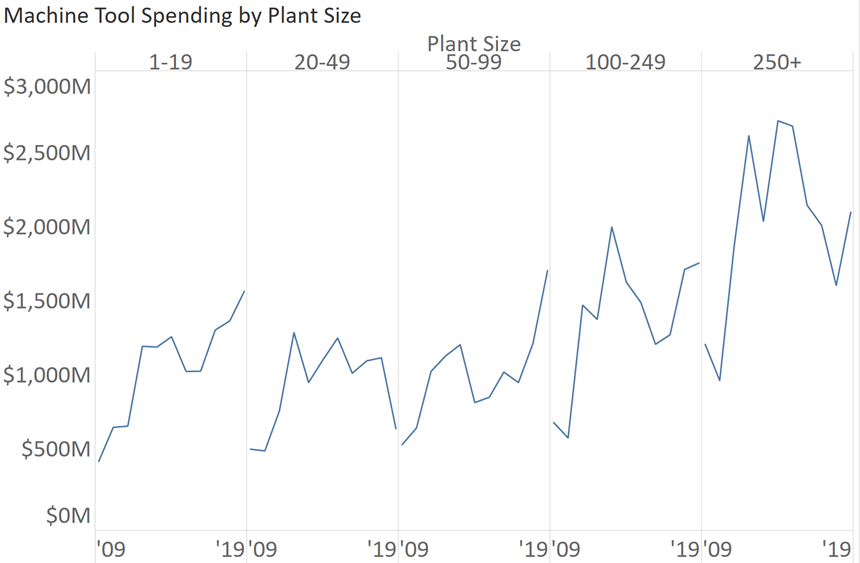
Trends from the GBI: Metalworking compare well with 2019 Capital Spending Survey data. Chart 5 shows machine-tool consumption over the past 10 years by plant size. Facilities with more than 250 employees are projected to increase their spending in 2019. However, this increased spending will merely return these facilities to the average level of spending over the past decade. This pattern is generally true for facilities with 100 to 249 employees as well. These shops, which represent the core set of buyers, simply are purchasing machine tools at the rate to which they are accustomed.
The trend in machine tool consumption for facilities with fewer than 100 employees is notably different. Shops with 50 to 99 employees and those with fewer than 20 are projected to spend more on machine tools next year than any other year in the last decade, and probably will spend more than any other year in the past two decades. Therefore, these smaller shops (the marginal buyers) are projected to drive the machine tool market to its highest level since 2000.
Since 2017, machine tools have been in high demand. In fact, demand has surpassed supply so much so that average lead times for a machine tool have increased from the normal four or five months to eight months and as many as two years for certain types of machines. As expected, machine tool prices have also risen because demand has increased faster than supply. Perhaps not as expected, the current economic trends in the machine-tool market are largely traceable to small shops as a group. They are ultimately responsible for driving the economics of the machine tool market.
Other Significant Spending Trends
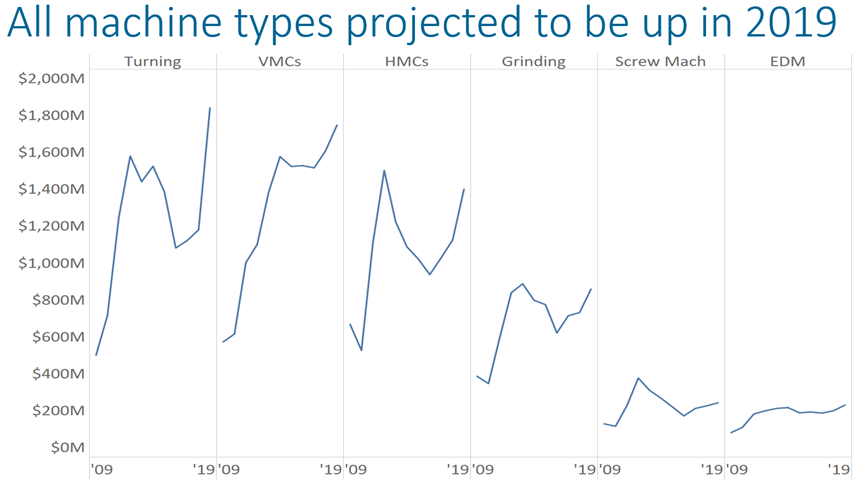
This year’s Capital Spending Survey projects that spending on every one of the six major machine types tracked by the survey—turning, vertical machining centers (VMCs), horizontal machining centers (HMCs), grinding machines, screw machines and electrical discharge machining (EDM) equipment—will increase in 2019 (see chart 6). Growth in turning-equipment spending is highest with a projected increase of 56 percent. The biggest increase within this category is expected to be that of horizontal lathes with 10-inch (or smaller) chucks, although larger lathes are projected to see a significant increase, too. Spending on VMCs with a 20-inch (or larger) Y axis will increase, whereas spending on smaller machines will decrease. Spending on HMCs of all sizes is projected to increase. The rise in screw machine spending is likely to come from that of single- and multispindle CNCs. For EDM equipment, spending on wire-type machines will dominate.
In 2019, job shops are projected to spend roughly $2.2 billion on machine tools, more than twice as much as any other end market. Because job shops are generally small, they function as the marginal buyers in the market. The machinery/equipment and automotive end markets plan to spend roughly $1 billion apiece next year. Job shops, machinery/equipment and automotive, which are the top three industry end-market categories, will account for approximately 60 percent of machine tool consumption. Planned spending in aerospace, pumps/valves/plumbing products, electronics/computers/telecommunications and forming/fabricating (non-auto) industries should slightly exceed $400 million. These seven industries combined are projected to consume nearly 80 percent of all machine tools purchased in 2019.
Spending in the North Central-West region is expected to grow for the third year, reaching almost $2.3 billion next year. This will make the region the largest buyer of machine tools in the country. Spending in this region will be dominated by job shops, which will account for approximately 33 percent of the region’s total. The region also will see strong spending from companies in forming/fabricating (non-auto), aerospace and medical markets. Planned spending in the North Central-East region totals approximately $1.8 billion. Combined, these two top regions will account for approximately 60 percent of all machine tool consumed in 2019.
Spending in the Southeast region is the biggest surprise of the survey. Shops in this region plan to spend nearly $1.2 billion on machine tools in 2019. This projection is more than 50-percent higher than any previous year for the region. Large increases in aerospace and automotive spending seem to be the reason.
More Details Available
The 2019 Capital Spending Survey provides spending projections for a variety of machine tools as well as for additive manufacturing machines, software and inspection/measurement equipment. Numbers are provided by plant size, region and industry. The full report can be purchased at gardnerintelligence.com.
Read Next
Setting Up the Building Blocks for a Digital Factory
Woodward Inc. spent over a year developing an API to connect machines to its digital factory. Caron Engineering’s MiConnect has cut most of this process while also granting the shop greater access to machine information.
Read MoreBuilding Out a Foundation for Student Machinists
Autodesk and Haas have teamed up to produce an introductory course for students that covers the basics of CAD, CAM and CNC while providing them with a portfolio part.
Read More5 Rules of Thumb for Buying CNC Machine Tools
Use these tips to carefully plan your machine tool purchases and to avoid regretting your decision later.
Read More

.JPG;width=70;height=70;mode=crop)


.jpg;maxWidth=300;quality=90)


.jpg;maxWidth=300;quality=90)


