Overall, the data from this year’s Top Shops benchmarking survey reveal what one would expect: Shops that are considered best-in-class realize better manufacturing and financial performance than others. However, the data also provide clues about how and why the Top Shops are able to achieve that higher level of performance. What’s interesting is that in some cases, their methods and even individual characteristics are different than might be anticipated. This is reflected in the following comparison of some key business and financial metrics reported by companies in the Top Shops benchmarking group and other survey participants.
Turning Sales into Profits
When it comes to top line performance, the average gross sales for the Top Shops in 2011 were 14 percent higher than the other shops, and the Top Shops’ median gross sales were nearly 20 percent higher. Better top line performance wasn’t demonstrated only in terms of gross sales, either. The Top Shops saw significantly healthier sales growth over recent years than other shops. The average growth in gross sales from 2009 to 2011 for the Top Shops was 51.6 percent compared to just 25.1 percent for other shops. The median growth rate in sales was significantly higher for the Top Shops, too, at 41.7 percent versus 24.2 percent.
More importantly, the Top Shops do a better job at turning revenue into profit. The survey shows that the Top Shops had an average net income margin (which is defined as net income divided by gross sales) of 18.9 percent last year compared to just 10.3 percent for the other shops. Plus, the median net income margin for the Top Shops was more than double that of the other shops at 12.9 percent versus 5.9 percent.
The following example can help put this in dollar terms. An average shop makes 10 cents of profit for each dollar of sales. However, because the Top Shops generate 14 percent more sales, they have $1.14 in sales compared to $1 for the other shops. Because the Top Shops are better at turning sales into profit, the Top Shops make more than 11 cents of profit on those sales (the amount they would make if they had the same net income margin as the other shops). Instead, they turn the higher sales figure into 22 cents of profit. So, when factoring in higher gross sales and greater ability to turn those sales into profit, it’s clear that in absolute dollars, the Top Shops make more than double the profit of the other shops on average.
Using Effective Marketing Tools
Some of the business practices that distinguish the Top Shops from the others likely play important roles in their better financial performance. One possible reason the Top Shops generate more sales is that they apply sales and marketing tools more effectively than other shops. The Top Shops seem to have not only a better appreciation of the importance of sales and marketing, but also a clearer understanding of how to actually market their businesses. Evidence for this is found in the responses to a survey question about the sales and marketing tools shops are most likely to use. Compared to other shops, the Top Shops were significantly more apt to use customer tours, brochures/catalogs, print advertising and tradeshows/events to promote their businesses. Of those, the tool that the Top Shops felt most strongly about using compared to the other shops was customer tours. An impressive 70 percent of the Top Shops conduct customer tours versus only 45.6 percent of the other shops.
For the Top Shops, these customer tours provide the opportunity to promote their advanced capabilities and demonstrate their pride in their work and employees. Perhaps this greater use of customer tours speaks to why the Top Shops have a higher quote-to-book ratio (which is defined as business booked as a percentage of business quoted) than the other shops. The average ratio for the Top Shops is 65.2 percent versus 53 percent for the other shops, while median ratios are 75 percent and 60 percent, respectively.
Implementing Supply Chain Strategies
One contributing factor to the Top Shops’ noticeably higher net income margin is greater emphasis on several supply chain strategies that reduce their overall expenses. Compared to other shops, the Top Shops were at least 10 percentage points more likely to use five particular supply chain practices listed in the survey: collaborative design with suppliers, just-in-time deliveries to customers, just-in-time deliveries to suppliers, access to customer forecasts and customer-satisfaction surveys. While collaborative design with suppliers is employed only by roughly one-third of all the Top Shops, the Top Shops were more than twice as likely as the other shops to implement this supply chain strategy. This approach likely enables the Top Shops to develop more efficient and less costly processes to meet customers’ needs.
The Top Shops were also much more likely to apply just-in-time practices with both suppliers and customers alike. This strategy probably helps reduce costs while also serving to enmesh the shops in the supply chain and make them more difficult to replace.
Investing in Employees and Capital Equipment
Shops invest in employees and equipment differently, as the survey data shows. With regard to employment, the median Top Shop has virtually the same number of total employees as the other shops. On average, however, the Top Shops have slightly fewer employees. More importantly, the Top Shops have a greater percentage of employees directly involved in manufacturing (72 percent versus 63.8 percent in 2011). Therefore, Top Shops require less overhead, especially as they get bigger.
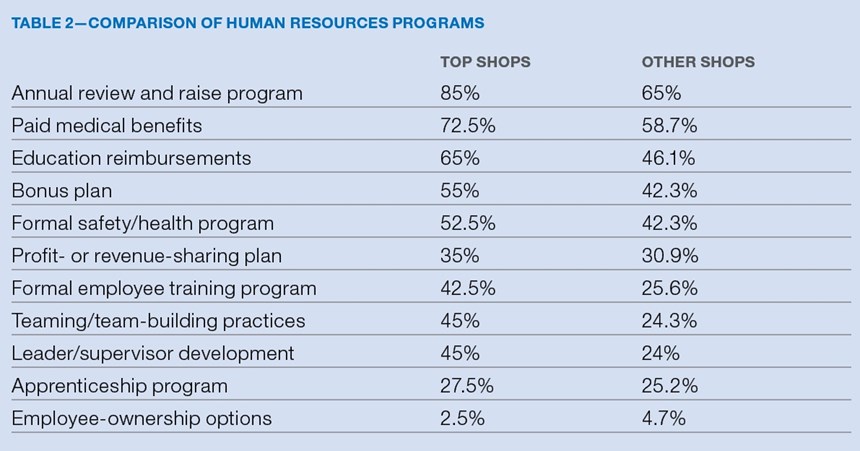
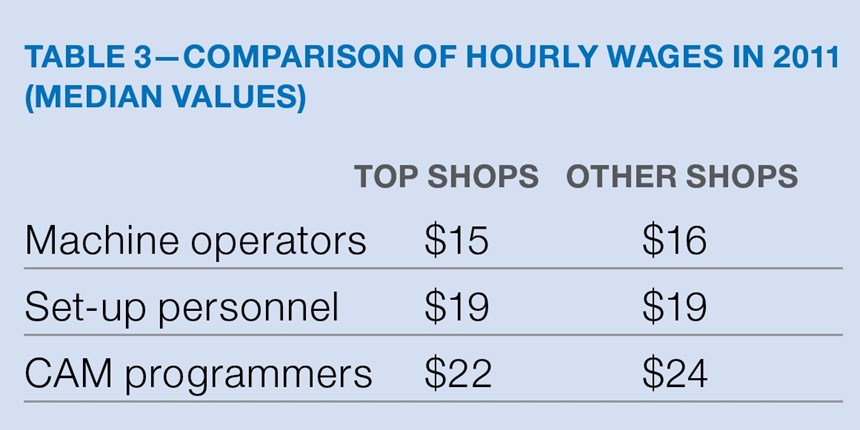
In addition to having fewer employees (albeit more of whom are involved in manufacturing), the Top Shops pay slightly lower hourly wages than the other shops. However, this doesn’t mean the Top Shops don’t invest in their employees. For example, the Top Shops are more likely to implement various human resource initiatives. Most notably, they are more apt to provide leadership development programs, team-building practices, annual performance review and raise programs, education reimbursements, and formal employee training. Per the survey data, the Top Shops were at least 17 percentage points more likely than the other shops to use each of these practices and programs. While all employees want to make more money, the best ones are motivated by personal growth and satisfaction. The Top Shops seem to place more emphasis on those important factors.
That said, even though the hourly wage rates are slightly lower for the Top Shops, they are more likely to offer paid medical benefits, bonus plans and profit- or revenue-sharing plans. However, the end result is that, as a percentage of gross sales, the Top Shops have spent significantly less than the other shops on total employee costs during each of the last three years. In other words, they are better at leveraging the skills of their employees to generate greater revenue.
Although the Top Shops spend less on total employment as a percent of gross sales, the same is not true of capital equipment. During each of the last three years, the median Top Shop spent a larger percentage of gross sales on capital equipment. During this same period, the average Top Shop spent more on capital equipment as a percent of gross sales in 2009, but less in 2010 and 2011. However, the average dollars the Top Shops spent on capital equipment remained relatively constant over the three-year period, while the other shops’ spending steadily increased. Also, the median and average values for yearly dollars spent on capital equipment are closer for Top Shops than the other shops. This information suggests that the Top Shops are more consistent over time in capital equipment spending as a percentage of gross sales. It also suggests a fair amount of consistency among the Top Shops in their spending. In contrast, the other shops seem to let capital spending fall during bad business periods, and total spending varies more widely from shop to shop.
Consistency is Key
It seems that the consistency in capital equipment spending—that is, investing for the future—plays a key role in the Top Shops’ ability to generate better financial returns and superior manufacturing performance. Also, this pattern of spending, combined with survey data on the number of machines at a shop, capacity utilization, machine uptime and spindle utilization, indicates that the Top Shops are likely buying machines for their capability enhancements, while the other shops buy equipment for additional capacity.
As was the case last year, this year’s survey data demonstrate that the Top Shops are more willing to make significant, sustained investments in their businesses. The trends in capital spending seem to prove this point. Such a business strategy enables the Top Shops to develop processes that more capably and efficiently meet their customers’ needs. In the long run, this leads to more sales and higher profits than others.


.JPG;width=70;height=70;mode=crop)


.jpg;maxWidth=300;quality=90)


