Published
Annual Industrial Production Growing at 7.5 Percent
A 7.5 percent rate of change in industrial production ranks in the 25 percent of all annual growth rates since 1966.
Share


Takumi USA
Featured Content
View More
ECi Software Solutions, Inc.
Featured Content
View More.png;maxWidth=45)
DMG MORI - Cincinnati
Featured Content
View More


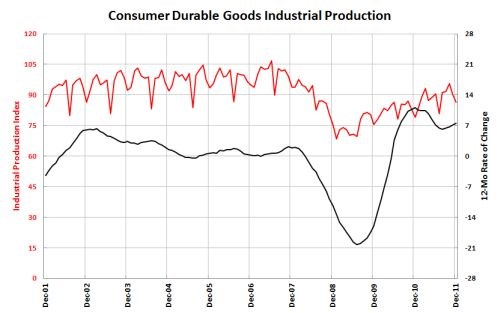
The consumer durable goods industrial production index was 86.5 in December 2011. December is typically one of two seasonal lows in the industrial production data. While December saw the second lowest index value in 2011, the reading was 9.2 percent higher than in December 2010. The one-month rate of change has grown by more than 9 percent each of the three months prior. To give you an idea of how strong this growth rate is, since 1965 the average rate of month-over-month growth is just 3.2 percent. A 9 percent growth rate ranks in the upper 25 percent of all rates of growth since 1965.
Recent growth in industrial production has been strong enough that the annual rate of growth has been accelerating each of the last four months. The annual rate of change was 7.5 percent in December, which compares to an average of 2.9 percent since 1966. This also ranks in the 25 percent of all annual growth rates since 1966.
A good leading indicator for consumer durable goods industrial production is consumer durable goods spending. If we look at the levels of spending and production in the United States since 1972, then we can see that there is a lot of room for growth if we compare spending and production to their historical relationship with each other. While there is plenty of room for growth in industrial production, the annual rate of spending growth has been slowing. But, spending is slowing from a historically high level. So, even though the leading indicator is pointing towards some slowing in industrial production, it looks like industrial production should remain strong in the near term at least.

.JPG;width=70;height=70;mode=crop)


.jpg;maxWidth=300;quality=90)


