American Manufacturing on the Rise
The strength of U.S. manufacturing is driving machine tool sales to their highest levels in more than a decade. Our survey says that machine tool sales should rise to $7.442 billion in 2014, an increase of 19 percent over 2013.
In August 2013, I was asked to give a presentation in Zurich, Switzerland to a group of manufacturers regarding the strength of capital equipment investment in the United Sates. My assignment was to determine if the strong capital investment was a result of a resurrection in American manufacturing.
A resurrection? I thought that was an odd word choice because it meant U.S. manufacturing was coming back from the dead. Apparently, the much repeated idea in the American media that America didn’t manufacture anything anymore was common knowledge to Swiss manufacturing companies. However, I pointed out that our data shows that American manufacturing is not being resurrected. Instead, it’s merely rebounding after a deep recession.
Despite the popular, yet ill-informed perception, American manufacturing never went away. Industrial production of durable goods, except for the periodic recession, has been growing continuously and significantly since the early 1970s. According to this index, the United States is producing more durable goods today than it ever has. Each month of 2013 saw a record high for that month in the durable goods index. In September (the most recent data available when this article was written), the durable goods production index reached its highest level ever.
In addition to production levels being at their highest points, capacity utilization continues to climb, too. During the worst of the recession, capacity utilization fell to nearly 60 percent. Today, capacity utilization is approaching 77 percent. Based on a leading indicator that I follow, it appears that capacity utilization will continue to rise in 2014.
High levels of industrial production and strong and improving capacity utilization at metalworking facilities have resulted in dramatically increased levels of investment in equipment and tooling. Other factors driving the purchase of machine tools higher include reshoring and the lack of skilled labor.
Why should a buyer of equipment and tooling care about this level of spending, the market segments that are buying equipment or the types of equipment and tooling that are being purchased? Because an informed buyer makes better decisions. Understanding the types of machines, workholding devices and tooling that the plants in your industry are buying can give you clues about the types of processes your competitors are using to make parts more productively. Also, knowledge of these trends can help you understand where you might have leverage on pricing.
Information about metalworking spending trends can be found in Gardner Business Media’s Metalworking Capital Spending Survey. This past July, Gardner sent surveys to readers of its Modern Machine Shop, Automotive Design and Production, Production Machining and Moldmaking Technology magazines asking them about their spending plans for capital equipment, workholding and tooling for 2014. Based on these responses, Gardner forecasts spending by industry on specific machine types, workholding processes and tooling types. The responses can also be forecast by plant size and region of the country. This article highlights some of the key takeaways from our recent survey.
Metalworking’s Important Leading Indicators
I watch a series of leading indicators to sense where the metalworking industry is headed. A very important leading indicator for durable goods production is “real capital goods new orders.” Real capital goods new orders is a very volatile data series because it includes aerospace orders. That said, analyzing the data based on the rate of change (the percent change between two corresponding time periods) makes it much easier to see the trend in real capital goods new orders.
In five of the last six months, real capital goods new orders increased compared to the same month one year ago. Some of this increase was due to large aerospace orders over the summer. As a result, the annual rate of change has grown faster in three of the last four months (see Chart 1). The improving monthly numbers should lead to an even faster rate of growth (as noted in the chart below, the blue line moving higher above zero on the chart). Also, the relatively strong growth in consumer spending indicates that real capital goods new orders should continue to improve.
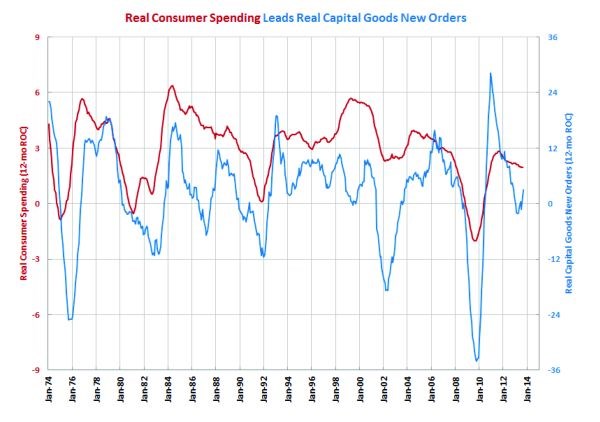
Chart 1 – The current trend of slightly slower growth in real consumer spending typically leads a period of significantly accelerating growth in real capital goods new orders.
Real capital goods new orders is a very good leading indicator for durable goods industrial production, which is a good proxy for the production level of the metalworking industry. As I mentioned above, durable goods production levels are at all-time highs. However, the rate of growth in durable goods production has been slowing for most of 2013 as the rate of growth in capital goods new orders slowed (see Chart 2). With improving real capital goods new orders, industrial production looks like it should start growing faster again in 2014. In fact, compared to the same month one year ago, durable goods production has grown faster each of the last two months, and September’s rate of growth was the fastest in 2013. The improving month-over-month growth numbers indicate that the annual rate of change in production shown in the chart above should trend up in 2014.
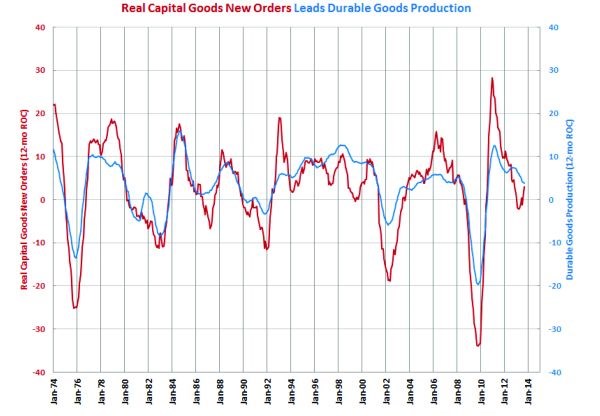
Chart 2 – The dramatic turnaround in the growth rate of real capital goods new orders is a sign that durable goods production should start growing faster in the early part of 2014.
In addition to the high level of industrial production, capacity utilization continues to rise. While capacity utilization has grown at historically high rates since the beginning of 2011, the rate of growth has been slowing down (see Chart 3). Forecasting capacity utilization can be difficult, but based on the chart, it appears that the backlog sub-index (the red line) from the Metalworking Business Index (MBI) is a good leading indicator of durable goods capacity utilization. Backlogs are still contracting, but they are contracting at a significantly slower rate. This turnaround in the rate of change in backlogs indicates that capacity utilization should grow faster in 2014.
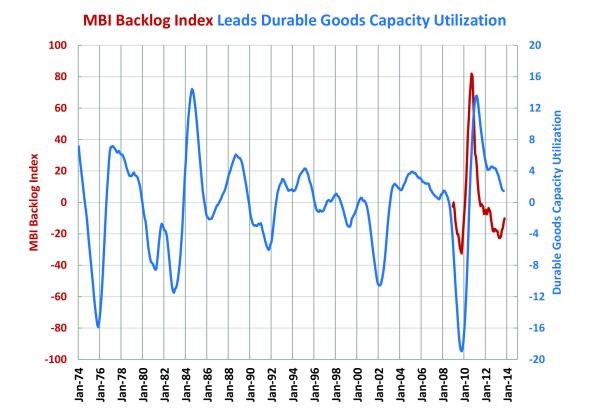
Chart 3 – The backlog index from the Metalworking Business Index has proven to be a good leading indicator for capacity utilization at durable goods manufacturers. The trend in backlogs is pointing to accelerating growth in capacity utilization.
Leading Indicators Point to Higher Spending
The best leading indicators for spending on machine tools are industrial production and capacity utilization. Chart 4 compares the rate of change in durable goods industrial production to machine tool unit sales. The chart shows that industrial production leads machine tool sales by 12 to18 months on average. The slower rate of growth in durable goods production over the last year has led to relatively flat machine tool sales in 2013. Unit sales will likely contract in the last few months of 2013. With industrial production set to grow faster in 2014, however, machine tool sales should pick up in the second half of 2014. My forecast is for an approximate 5 percent increase in machine tool unit sales in 2014.
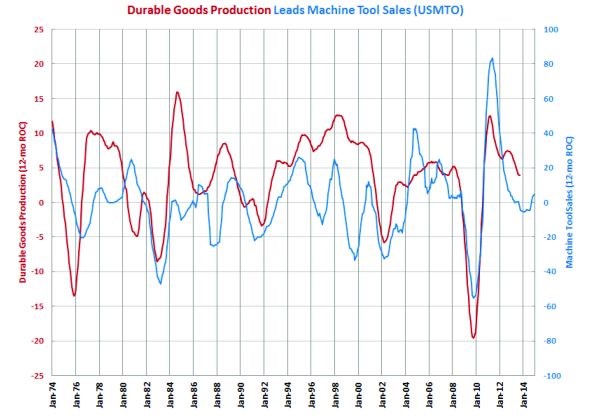
Chart 4 – The current trend in durable goods production will lead to softer machine tools in late 2013 and early 2014. As production starts to grow faster in early 2014, machine tool sales should follow suit in the second half of 2014.
Also, capacity utilization is highly correlated to machine tool sales. Chart 5 shows that for a given capacity utilization, we can forecast machine tool sales. Our Metalworking Capital Spending Survey indicates that current capacity utilization is 77 percent, and the machine tool consumption should be $7.442 billion in 2014. The red line on the chart represents the optimal demand of machine tool sales for any capacity utilization. Right away, we can see that machine tool sales are rarely at the optimal level. This is because metalworking facilities cannot buy fractions of a machine. Also, shops tend to buy more capacity than they need and then grow their way into that capacity. So, metalworking facilities always are either overbuying or underbuying the market. On this chart, points that fall above the optimal line represent overbuying by metalworking facilities; points that fall below the line represent underbuying. Careful study of the chart shows that four- to seven-year groups tend to collect above or below the line.
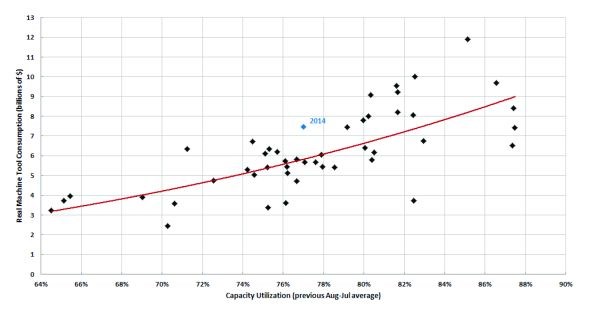
Chart 5 – The red line represents optimal machine tool demand. The industry typically overbuys or underbuys optimum demand in four to seven year cycles. 2014 would represent the fifth year of overbuying.
Our data shows that the industry overbought machine tools during the last four years. Therefore, if our survey is correct, 2014 will represent the fifth consecutive year of overbuying. However, shops seem to be indicating more machine tool consumption than is likely based on capacity utilization. In Chart 5, the point for 2014 is one of the furthest from the line. Plus, the United States has never seen more than $7 billion of machine tool sales without capacity utilization reaching at least 79 percent. While capacity utilization is improving, it likely will not hit 79 percent. Therefore, I think machine tool consumption is more likely to fall between $6.5 and $7.0 billion.
While machine tool unit sales have been relatively flat in 2013, dollar sales have been contracting at an accelerating rate. This means that the average price of a machine has been contracting at a faster rate in the second half of 2013. While demand looks to be going up, which would have a tendency to increase machine prices, the U.S. is the most attractive market for machine tool builders. In fact, the U.S. is likely to be the second largest machine tool market in the world in 2014. It also is likely to be the only one of the top five markets to see growth next year. This means the U.S. market should be very competitive in 2014, which should help hold prices down next year.
General Spending Trends
An important reason why shops are buying new machines is “process flexibility.” One factor driving this need is the lack of skilled labor at metalworking facilities. Therefore, shops need more automation so that fewer workers can run more machines to produce more parts. Automation, whether that be pallet changers, bar feeders, robots or other equipment, is one of the hottest topics regarding capital spending.
Therefore, like last year, horizontal machining centers (HMCs) will be more preferred compared to vertical machining centers (VMCs) in 2014. A significant reason for this is that horizontal machines are more easily automated than vertical machines. In addition to HMCs being preferred to vertical machines, our survey indicates that larger machines will be preferred to smaller machines in 2014. Better business conditions and higher profitability are making it easier for shops to afford more expensive horizontal machines and larger machines. However, lathes seem to be bucking these general trends as spending on vertical lathes and smaller lathes is growing faster than the other parts of the lathe market.
A final general spending trend in this year’s survey is that large facilities plan on spending significantly more money. Facilities with more than 250 employees will account for nearly a third of all machine tool sales in 2014. That would be nearly a 150 percent increase over 2013. This makes sense given that our business index shows that the largest shops have had the best business conditions in 2013.
End Market Spending Trends
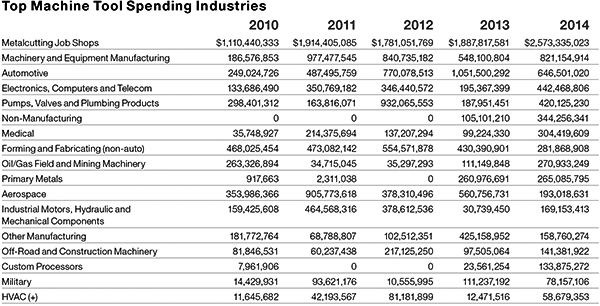
Metalcutting job shops will remain the largest spending industry segment in 2014. Spending at job shops will be about $2.6 billion, or nearly 33 percent of all spending. This represents a 36 percent increase in spending on machine tools by job shops. One reason for the increased investment is that automotive and aerospace OEMs are pushing work down through the supply chain. Therefore, while investment is up in job shops, it looks to be down in automotive and aerospace facilities in 2014 according to our survey.
A second reason for the significant increase in spending by job shops is activity in the die and mold industry. Industrial mold shops are projected to spend $549 million on machine tools in 2014, which would be an increase of 151 percent. That means industrial mold shops will account for nearly 20 percent of all spending by job shops for the first time since 2008. The die and mold industry, which many thought had departed to China for good, is one of the hottest sectors of the U.S. metalworking industry.
Approximately 55 percent of spending by job shops will be for machining centers. Spending on HMCs will increase nearly 80 percent (almost all of this increase is from horizontals with pallets greater than 800 mm), while spending on VMCs will fall somewhat. Turning centers will likely be the fastest growing equipment category amongst job shops. In addition, the trend of increased spending on screw machines by job shops will likely continue. Spending on screw machines by job shops should nearly triple in 2014 with nearly half of the projected spending being for CNC Swiss-type machines.
Electronics is probably the industry that has been most positively affected by reshoring. Since 2010, capacity utilization in this industry has remained between 76 and 80 percent. Therefore, spending is projected to increase dramatically in the electronics, computers and telecommunications markets. Our survey indicates that this industry will spend $442 on machine tools in 2014, which would be an increase of 127 percent compared to 2013 and the highest level of investment by this industry since 2008. Within this market, particularly strong sectors include semiconductors and industrial process-control variables. A little more than 20 percent of the spending in the electronics industry will be on HMCs with a 400- to 800-mm pallet. Two other strong areas of spending include horizontal lathes and turning centers with less than 10-inch chucks.
Another industry with significant growth in machine tool spending is pumps, valves and plumbing products. By now, everyone is aware of the increased investment in natural gas exploration and drilling (fracking) in the United States. But now that we have all of this natural gas, what do we do with it? Currently, there is insufficient storage and transportation (either pipelines or tankers) capacity for natural gas. Hence, spending on machine tools by this market is projected to jump to $420 million in 2014, which is an increase of 123 percent. Much of the spending in this industry will come from manufacturers of pumps and pumping equipment and air and gas compressors. In addition, there will be a significant increase in spending by fabricated pipe manufacturers. Spending will be concentrated in the East North Central and Middle Atlantic (where some of the largest natural gas reserves in the country have been found) and the West South Central (i.e., Texas). Much of the increase investment will be on HMCs with a less than 800-mm pallets. Also, there will be a noticeable increase on vertical lathes as well as small horizontal lathes.
Be Informed
Understanding the investment trends of metalworking facilities will help you become a more informed buyer. It will also give you insight into new of ways of machining that you should investigate if you see companies in your industry buying equipment that is different than yours. Finally, having an understanding of the investment trends can help you plan strategically for business and identify potential growth markets to pursue for new business.
Read Next
The Future of High Feed Milling in Modern Manufacturing
Achieve higher metal removal rates and enhanced predictability with ISCAR’s advanced high-feed milling tools — optimized for today’s competitive global market.
Read MoreIncreasing Productivity with Digitalization and AI
Job shops are implementing automation and digitalization into workflows to eliminate set up time and increase repeatability in production.
Read MoreIMTS 2024: Trends & Takeaways From the Modern Machine Shop Editorial Team
The Modern Machine Shop editorial team highlights their takeaways from IMTS 2024 in a video recap.
Read More
.JPG;width=70;height=70;mode=crop)











.jpg;maxWidth=300;quality=90)


